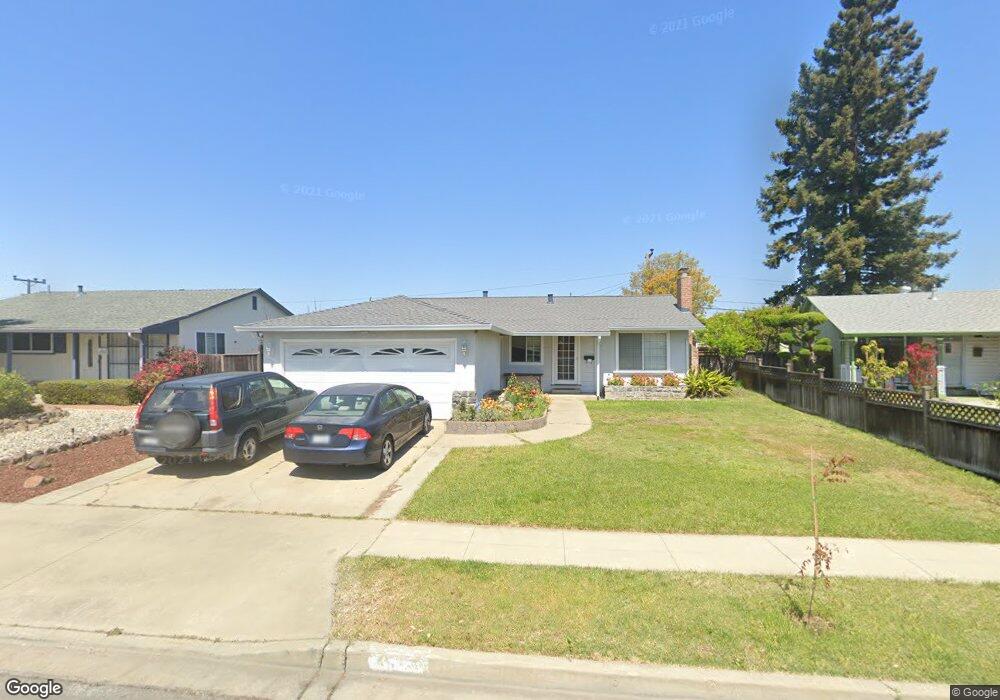
4555 Piper St Fremont, CA 94538
Sundale NeighborhoodEstimated Value: $1,269,000 - $1,387,000
3
Beds
2
Baths
1,148
Sq Ft
$1,166/Sq Ft
Est. Value
About This Home
This home is located at 4555 Piper St, Fremont, CA 94538 and is currently estimated at $1,338,527, approximately $1,165 per square foot. 4555 Piper St is a home located in Alameda County with nearby schools including John Blacow Elementary School, G.M. Walters Middle School, and John F. Kennedy High School.
Ownership History
Date
Name
Owned For
Owner Type
Purchase Details
Closed on
Oct 7, 2010
Sold by
Alejo Maria C
Bought by
Sandell Thomas R and Sandell Angela P
Current Estimated Value
Home Financials for this Owner
Home Financials are based on the most recent Mortgage that was taken out on this home.
Original Mortgage
$377,302
Outstanding Balance
$250,873
Interest Rate
4.5%
Mortgage Type
FHA
Estimated Equity
$1,087,654
Purchase Details
Closed on
Dec 11, 2006
Sold by
Alejo Sergio
Bought by
Alejo Maria C
Home Financials for this Owner
Home Financials are based on the most recent Mortgage that was taken out on this home.
Original Mortgage
$130,600
Interest Rate
6.33%
Mortgage Type
Stand Alone Second
Purchase Details
Closed on
Dec 9, 2006
Sold by
Cistone Deanna L
Bought by
Alejo Maria C
Home Financials for this Owner
Home Financials are based on the most recent Mortgage that was taken out on this home.
Original Mortgage
$130,600
Interest Rate
6.33%
Mortgage Type
Stand Alone Second
Purchase Details
Closed on
Oct 30, 1997
Sold by
Cistone William J
Bought by
Cistone Deanna L
Home Financials for this Owner
Home Financials are based on the most recent Mortgage that was taken out on this home.
Original Mortgage
$180,000
Interest Rate
10.2%
Create a Home Valuation Report for This Property
The Home Valuation Report is an in-depth analysis detailing your home's value as well as a comparison with similar homes in the area
Home Values in the Area
Average Home Value in this Area
Purchase History
| Date | Buyer | Sale Price | Title Company |
|---|---|---|---|
| Sandell Thomas R | $410,000 | Fidelity National Title Co | |
| Alejo Maria C | -- | Fidelity National Title Co | |
| Alejo Maria C | $653,000 | Fidelity National Title Co | |
| Cistone Deanna L | $18,000 | Chicago Title Co |
Source: Public Records
Mortgage History
| Date | Status | Borrower | Loan Amount |
|---|---|---|---|
| Open | Sandell Thomas R | $377,302 | |
| Previous Owner | Alejo Maria C | $130,600 | |
| Previous Owner | Alejo Maria C | $522,400 | |
| Previous Owner | Cistone Deanna L | $180,000 |
Source: Public Records
Tax History
| Year | Tax Paid | Tax Assessment Tax Assessment Total Assessment is a certain percentage of the fair market value that is determined by local assessors to be the total taxable value of land and additions on the property. | Land | Improvement |
|---|---|---|---|---|
| 2025 | $6,655 | $525,250 | $157,575 | $367,675 |
| 2024 | $6,655 | $514,955 | $154,486 | $360,469 |
| 2023 | $6,469 | $504,861 | $151,458 | $353,403 |
| 2022 | $6,374 | $494,964 | $148,489 | $346,475 |
| 2021 | $6,221 | $485,258 | $145,577 | $339,681 |
| 2020 | $6,199 | $480,285 | $144,085 | $336,200 |
| 2019 | $6,132 | $470,871 | $141,261 | $329,610 |
| 2018 | $6,011 | $461,643 | $138,493 | $323,150 |
| 2017 | $5,862 | $452,594 | $135,778 | $316,816 |
| 2016 | $5,757 | $443,721 | $133,116 | $310,605 |
| 2015 | $5,675 | $437,060 | $131,118 | $305,942 |
| 2014 | $5,574 | $428,498 | $128,549 | $299,949 |
Source: Public Records
Map
Nearby Homes
- 4560 Piper St
- 4475 Millard Ave
- 4498 Ladner St
- 4412 Millard Ave
- 4612 Drury Ct
- 4859 Hilo St
- 4508 Stevenson Blvd
- 4637 Stratford Ave
- 4531 Stevenson Blvd
- 40422 Landon Ave
- 39904 Lindsay Mcdermott Ln Unit 8
- 4463 Hyde Common Unit 116
- 4310 Providence Terrace
- 40431 Blanchard St
- 4600 Nelson St
- 39773 Costa Way
- 39676 Bruning St
- 3861 Cosmic Place
- 40452 Citrus Dr
- 39630 Blacow Rd
Your Personal Tour Guide
Ask me questions while you tour the home.