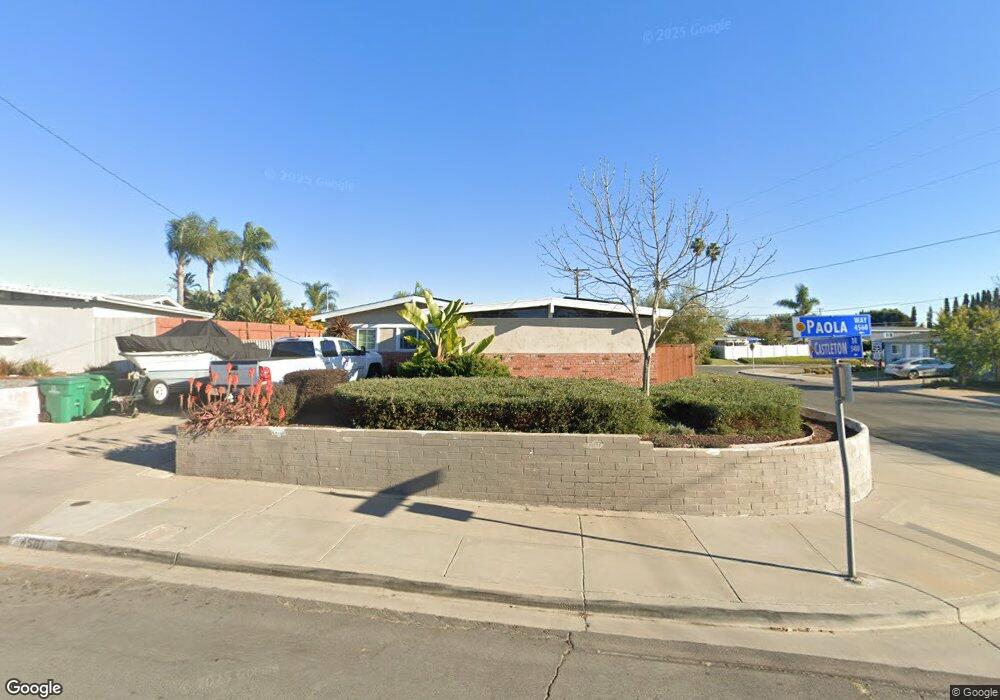
4561 Paola Way San Diego, CA 92117
Clairemont Mesa East NeighborhoodEstimated Value: $893,649 - $1,015,000
3
Beds
1
Bath
1,008
Sq Ft
$929/Sq Ft
Est. Value
About This Home
This home is located at 4561 Paola Way, San Diego, CA 92117 and is currently estimated at $936,912, approximately $929 per square foot. 4561 Paola Way is a home located in San Diego County with nearby schools including Sequoia Elementary School, Innovation Middle School, and Madison High School.
Ownership History
Date
Name
Owned For
Owner Type
Purchase Details
Closed on
Jul 30, 2021
Sold by
Kuy Jason and Kuy Nicole
Bought by
Kuy Jason Ciiaylee and Kuy Nicole Marie
Current Estimated Value
Purchase Details
Closed on
Jul 22, 2010
Sold by
Holleman Sandra Lynn and Holleman Carl David
Bought by
Kuy Jason and Kuy Nicole
Home Financials for this Owner
Home Financials are based on the most recent Mortgage that was taken out on this home.
Original Mortgage
$335,482
Outstanding Balance
$221,815
Interest Rate
4.62%
Mortgage Type
FHA
Estimated Equity
$715,097
Purchase Details
Closed on
Nov 5, 2009
Sold by
Holleman Sandra L and Holleman Sandra Lynn
Bought by
Holleman Sandra Lynn and Holleman Carl David
Purchase Details
Closed on
Sep 23, 2004
Sold by
Ramsey Lilyane S
Bought by
Ramsey Lilyane S and Lilyane S Ramsey Living Trust
Create a Home Valuation Report for This Property
The Home Valuation Report is an in-depth analysis detailing your home's value as well as a comparison with similar homes in the area
Home Values in the Area
Average Home Value in this Area
Purchase History
| Date | Buyer | Sale Price | Title Company |
|---|---|---|---|
| Kuy Jason Ciiaylee | -- | None Available | |
| Kuy Jason | $340,000 | Lawyers Title Sd | |
| Holleman Sandra Lynn | -- | None Available | |
| Holleman Sandra L | -- | None Available | |
| Ramsey Lilyane S | -- | -- | |
| Ramsey Lilyane S | -- | -- |
Source: Public Records
Mortgage History
| Date | Status | Borrower | Loan Amount |
|---|---|---|---|
| Open | Kuy Jason | $335,482 |
Source: Public Records
Tax History Compared to Growth
Tax History
| Year | Tax Paid | Tax Assessment Tax Assessment Total Assessment is a certain percentage of the fair market value that is determined by local assessors to be the total taxable value of land and additions on the property. | Land | Improvement |
|---|---|---|---|---|
| 2025 | $5,194 | $435,587 | $358,722 | $76,865 |
| 2024 | $5,194 | $427,047 | $351,689 | $75,358 |
| 2023 | $5,077 | $418,675 | $344,794 | $73,881 |
| 2022 | $4,940 | $410,467 | $338,034 | $72,433 |
| 2021 | $4,905 | $402,419 | $331,406 | $71,013 |
| 2020 | $4,845 | $398,293 | $328,008 | $70,285 |
| 2019 | $4,757 | $390,484 | $321,577 | $68,907 |
| 2018 | $4,447 | $382,828 | $315,272 | $67,556 |
| 2017 | $81 | $375,323 | $309,091 | $66,232 |
| 2016 | $4,268 | $367,965 | $303,031 | $64,934 |
| 2015 | $4,204 | $362,439 | $298,480 | $63,959 |
| 2014 | $4,137 | $355,341 | $292,634 | $62,707 |
Source: Public Records
Map
Nearby Homes
- 5656 Chandler Dr
- 5715 Castleton Dr
- 5768 Camber Dr
- 5783 Camber Dr
- 5404 Balboa Arms Dr Unit 461
- 5113 Bellvale Ave
- 5402 Balboa Arms Dr Unit 345
- 5402 Balboa Arms Dr Unit 415
- 5252 Balboa Arms Dr Unit 180
- 5252 Balboa Arms Dr Unit 171
- 5061 Canosa Ave
- 5124 Acuna St
- 4827 Rushden Ave
- 4979 Acuna St
- 4261 Cannington Dr
- 5170 Clairemont Mesa Blvd Unit 8
- 5170 Clairemont Mesa Blvd Unit 27
- 6602 Beadnell Way Unit 13
- 6666 Beadnell Way Unit 9
- 6666 Beadnell Way Unit 15
- 4571 Paola Way
- 5442 Castleton Dr
- 4541 Paola Way
- 4581 Paola Way
- 5514 Castleton Dr
- 4512 Limerick Ave
- 4568 Paola Way
- 5445 Castleton Dr
- 4556 Paola Way
- 4531 Paola Way
- 4580 Paola Way
- 5530 Castleton Dr
- 4546 Paola Way
- 4502 Limerick Ave
- 5517 Castleton Dr
- 4544 Castleton Way
- 4536 Paola Way
- 4521 Paola Way
- 4583 Limerick Way
- 5546 Castleton Dr