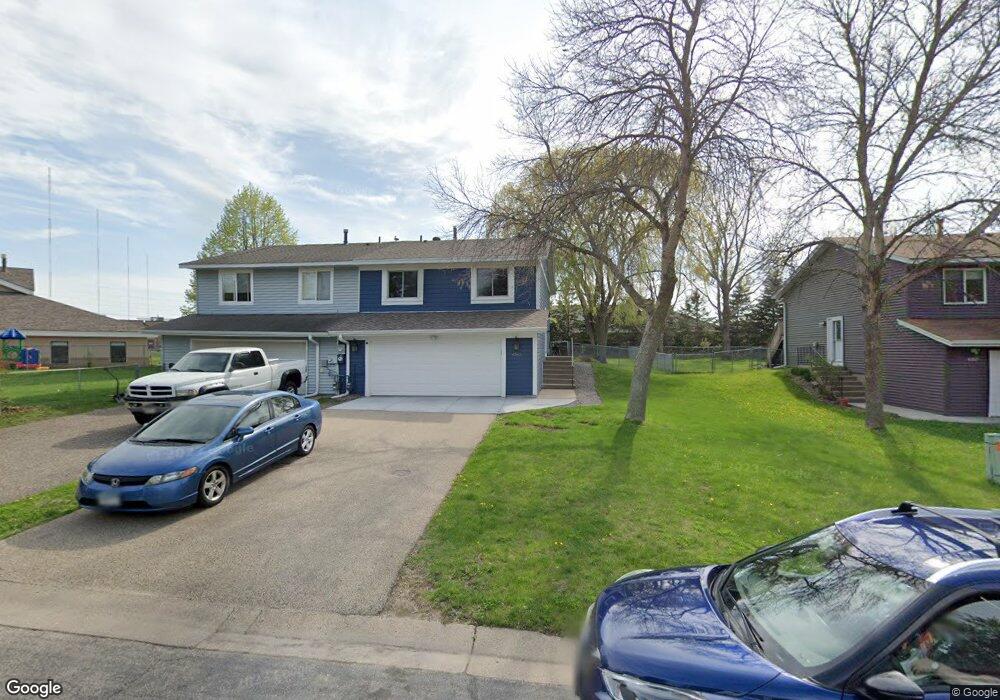
4561 Scott Trail Saint Paul, MN 55122
Estimated Value: $224,000 - $287,000
2
Beds
2
Baths
864
Sq Ft
$307/Sq Ft
Est. Value
About This Home
This home is located at 4561 Scott Trail, Saint Paul, MN 55122 and is currently estimated at $265,336, approximately $307 per square foot. 4561 Scott Trail is a home located in Dakota County with nearby schools including Oak Ridge Elementary School, Black Hawk Middle School, and Eastview Senior High School.
Ownership History
Date
Name
Owned For
Owner Type
Purchase Details
Closed on
Jan 23, 2015
Sold by
Garcia Rolando and Garcia Silvia
Bought by
Garcia Rolando and Garcia Silvia
Current Estimated Value
Home Financials for this Owner
Home Financials are based on the most recent Mortgage that was taken out on this home.
Original Mortgage
$118,000
Interest Rate
3.82%
Mortgage Type
New Conventional
Purchase Details
Closed on
Oct 27, 2005
Sold by
Aung Kyaw Soe and Aung Phyu Phyu
Bought by
Garcia Rolando and Garcia Mayolo
Purchase Details
Closed on
Jan 15, 2003
Sold by
Wilmer Michael A
Bought by
Laung Thyu and Laung Phyll
Purchase Details
Closed on
Jun 28, 1999
Sold by
Beier Kevin D and Beier Lori L
Bought by
Wilmer Michael A
Purchase Details
Closed on
Mar 1, 1999
Sold by
Wei Aiping and Wei Hong
Bought by
Beier Kevin D and Beier Lori L
Purchase Details
Closed on
Nov 2, 1998
Sold by
Hud
Bought by
Wei Aiping
Create a Home Valuation Report for This Property
The Home Valuation Report is an in-depth analysis detailing your home's value as well as a comparison with similar homes in the area
Home Values in the Area
Average Home Value in this Area
Purchase History
| Date | Buyer | Sale Price | Title Company |
|---|---|---|---|
| Garcia Rolando | -- | Fatco | |
| Garcia Rolando | $174,500 | -- | |
| Garcia Rolando | $174,500 | -- | |
| Laung Thyu | $159,500 | -- | |
| Wilmer Michael A | $102,000 | -- | |
| Beier Kevin D | $97,000 | -- | |
| Wei Aiping | $68,888 | -- |
Source: Public Records
Mortgage History
| Date | Status | Borrower | Loan Amount |
|---|---|---|---|
| Closed | Garcia Rolando | $118,000 |
Source: Public Records
Tax History Compared to Growth
Tax History
| Year | Tax Paid | Tax Assessment Tax Assessment Total Assessment is a certain percentage of the fair market value that is determined by local assessors to be the total taxable value of land and additions on the property. | Land | Improvement |
|---|---|---|---|---|
| 2024 | $2,442 | $226,100 | $37,300 | $188,800 |
| 2023 | $2,442 | $236,500 | $37,400 | $199,100 |
| 2022 | $2,232 | $240,800 | $36,200 | $204,600 |
| 2021 | $2,102 | $211,600 | $31,500 | $180,100 |
| 2020 | $1,854 | $196,500 | $30,000 | $166,500 |
| 2019 | $1,611 | $171,900 | $28,600 | $143,300 |
| 2018 | $1,446 | $160,500 | $27,200 | $133,300 |
| 2017 | $1,349 | $142,900 | $25,900 | $117,000 |
| 2016 | $1,206 | $130,000 | $24,700 | $105,300 |
| 2015 | $1,032 | $91,816 | $19,154 | $72,662 |
| 2014 | -- | $79,063 | $17,784 | $61,279 |
| 2013 | -- | $70,343 | $15,537 | $54,806 |
Source: Public Records
Map
Nearby Homes
- 2115 Cliffview Dr
- 2100 Viburnum Trail
- 4370 Nicols Rd
- 4488 Cinnamon Ridge Trail Unit B
- 4397 Onyx Dr
- 4463 Cinnamon Ridge Cir
- 2081 Copper Ln
- 4774 Slater Rd
- 1942 Grant Alcove Unit 65
- 4413 Slater Rd
- 1917 Jan Echo Trail
- 3306 Selkirk Dr
- 4247 Limestone Dr
- 3309 Red Oak Cir N
- 1949 Beaver Dam Ct
- 2079 Coral Ln
- 2041 Royale Dr
- 1743 Galaxie Ct
- 2014 Diffley Rd
- 240 River Woods Ln
- 4557 Scott Trail
- 4563 Scott Trail
- 4555 Scott Trail
- 4551 Scott Trail
- 4560 Scott Trail
- 4547 Scott Trail
- 4556 Scott Trail
- 4564 Scott Trail
- 4550 Scott Trail
- 4545 Scott Trail
- 4546 Scott Trail
- 4541 Scott Trail
- 2076 Cliffview Dr
- 2094 Cliffhill Ln
- 4542 Scott Trail
- 4539 Scott Trail
- 4535 Scott Trail
- 2090 Cliffhill Ln
- 2098 Cliffhill Ln
- 2075 Cliffview Dr