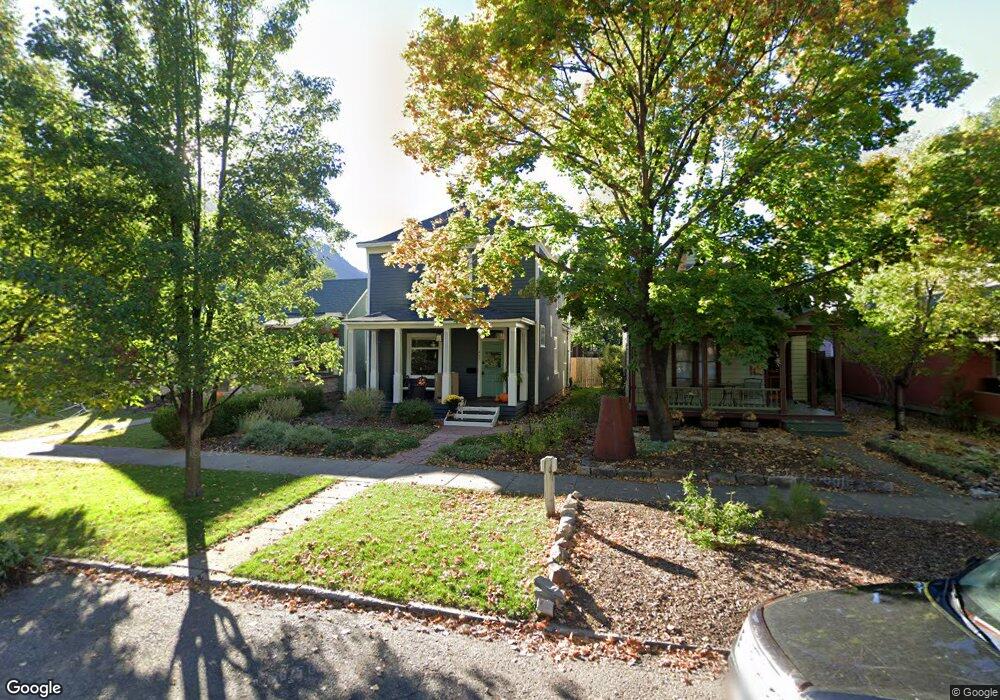
457 E 3rd Ave Durango, CO 81301
So Co NeighborhoodEstimated Value: $993,000 - $1,142,000
3
Beds
3
Baths
1,845
Sq Ft
$579/Sq Ft
Est. Value
About This Home
This home is located at 457 E 3rd Ave, Durango, CO 81301 and is currently estimated at $1,067,934, approximately $578 per square foot. 457 E 3rd Ave is a home located in La Plata County with nearby schools including Park Elementary School, Escalante Middle School, and Durango High School.
Ownership History
Date
Name
Owned For
Owner Type
Purchase Details
Closed on
Nov 30, 2020
Sold by
Garncarz Jermy E and Sandstedt Daniee C
Bought by
Kade Marc D
Current Estimated Value
Home Financials for this Owner
Home Financials are based on the most recent Mortgage that was taken out on this home.
Original Mortgage
$510,400
Outstanding Balance
$455,219
Interest Rate
2.8%
Mortgage Type
New Conventional
Estimated Equity
$612,715
Purchase Details
Closed on
Jul 10, 2012
Sold by
Simmons Scott and Simmons Holly
Bought by
Garncarz Jeremy E and Sandstedt Danielle C
Home Financials for this Owner
Home Financials are based on the most recent Mortgage that was taken out on this home.
Original Mortgage
$417,000
Interest Rate
3.79%
Mortgage Type
New Conventional
Purchase Details
Closed on
Dec 15, 2009
Sold by
Maynes Frank L and Gonzales Barbara J
Bought by
Simmons Scott and Simmons Holly
Create a Home Valuation Report for This Property
The Home Valuation Report is an in-depth analysis detailing your home's value as well as a comparison with similar homes in the area
Home Values in the Area
Average Home Value in this Area
Purchase History
| Date | Buyer | Sale Price | Title Company |
|---|---|---|---|
| Kade Marc D | $640,000 | Land Title Guarantee Co | |
| Garncarz Jeremy E | $528,500 | Colorado Land Title Co Llc | |
| Simmons Scott | $295,000 | Colorado Land Title Co |
Source: Public Records
Mortgage History
| Date | Status | Borrower | Loan Amount |
|---|---|---|---|
| Open | Kade Marc D | $510,400 | |
| Previous Owner | Garncarz Jeremy E | $417,000 |
Source: Public Records
Tax History
| Year | Tax Paid | Tax Assessment Tax Assessment Total Assessment is a certain percentage of the fair market value that is determined by local assessors to be the total taxable value of land and additions on the property. | Land | Improvement |
|---|---|---|---|---|
| 2025 | $2,359 | $58,690 | $13,400 | $45,290 |
| 2024 | $2,007 | $49,930 | $10,090 | $39,840 |
| 2023 | $2,007 | $53,120 | $10,740 | $42,380 |
| 2022 | $2,024 | $55,610 | $11,240 | $44,370 |
| 2021 | $2,033 | $51,210 | $9,680 | $41,530 |
| 2020 | $1,868 | $48,580 | $9,580 | $39,000 |
| 2019 | $1,787 | $48,580 | $9,580 | $39,000 |
| 2018 | $1,656 | $45,580 | $9,080 | $36,500 |
| 2017 | $1,619 | $45,580 | $9,080 | $36,500 |
| 2016 | $1,483 | $45,500 | $8,680 | $36,820 |
| 2015 | $1,389 | $45,500 | $8,680 | $36,820 |
| 2014 | -- | $39,810 | $8,340 | $31,470 |
| 2013 | -- | $28,490 | $8,340 | $20,150 |
Source: Public Records
Map
Nearby Homes
- 355 E 3rd Ave Unit 112
- 543 E 2nd Ave Unit 1D
- 610 E 3rd Ave
- 476 E 5th St
- 558 E 4th Ave
- 732 E 4th St
- 690 E 4th Ave
- 773 E 3rd Ave
- 378 E 6th Ave
- 768 Main Ave Unit 4
- 562 E 1st St
- 703 E 4th St
- 1 E 6th Ave Unit 3
- TBD Wilson Gulch Rd
- 190 E 7th Ave Unit A-2
- 235 Rock Point Dr Unit 235B
- 125 W 10th St Unit 104
- 634 E 8th Ave Unit 7
- 634 E 8th Ave
- 853 E College Dr
Your Personal Tour Guide
Ask me questions while you tour the home.