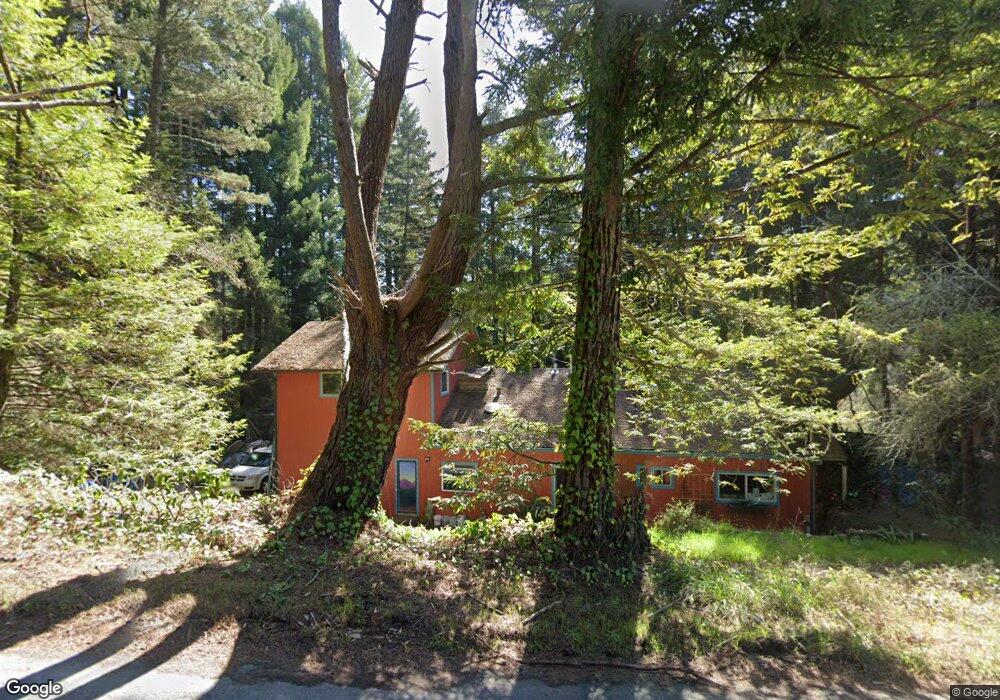
4580 Cummings Rd Eureka, CA 95503
Estimated Value: $391,597 - $590,000
3
Beds
1
Bath
1,660
Sq Ft
$296/Sq Ft
Est. Value
About This Home
This home is located at 4580 Cummings Rd, Eureka, CA 95503 and is currently estimated at $491,399, approximately $296 per square foot. 4580 Cummings Rd is a home located in Humboldt County with nearby schools including Freshwater Elementary School, Mistwood Montessori School, and Gospel Outreach School.
Ownership History
Date
Name
Owned For
Owner Type
Purchase Details
Closed on
May 9, 2012
Sold by
Tallman Willcut Steven J and Tallman Willcut Linda Sue
Bought by
Tallman Willcut Steven J and Willcut Tallman Linda Sue
Current Estimated Value
Home Financials for this Owner
Home Financials are based on the most recent Mortgage that was taken out on this home.
Original Mortgage
$145,000
Interest Rate
3.94%
Mortgage Type
New Conventional
Purchase Details
Closed on
Nov 5, 1998
Sold by
Tallman Willcut Steven Jay and Tallman Jay S
Bought by
Tallman Willcut Steven Jay and Willcut Tallman Linda Sue
Home Financials for this Owner
Home Financials are based on the most recent Mortgage that was taken out on this home.
Original Mortgage
$101,250
Interest Rate
6.54%
Mortgage Type
Purchase Money Mortgage
Create a Home Valuation Report for This Property
The Home Valuation Report is an in-depth analysis detailing your home's value as well as a comparison with similar homes in the area
Purchase History
| Date | Buyer | Sale Price | Title Company |
|---|---|---|---|
| Tallman Willcut Steven J | -- | Humboldt Land Title Company | |
| Tallman Willcut Steven Jay | -- | Fidelity National Title Co |
Source: Public Records
Mortgage History
| Date | Status | Borrower | Loan Amount |
|---|---|---|---|
| Closed | Tallman Willcut Steven J | $145,000 | |
| Closed | Tallman Willcut Steven Jay | $101,250 |
Source: Public Records
Tax History
| Year | Tax Paid | Tax Assessment Tax Assessment Total Assessment is a certain percentage of the fair market value that is determined by local assessors to be the total taxable value of land and additions on the property. | Land | Improvement |
|---|---|---|---|---|
| 2025 | $2,524 | $240,859 | $57,024 | $183,835 |
| 2024 | $2,524 | $236,137 | $55,906 | $180,231 |
| 2023 | $2,441 | $231,508 | $54,810 | $176,698 |
| 2022 | $2,529 | $226,970 | $53,736 | $173,234 |
| 2021 | $2,372 | $222,521 | $52,683 | $169,838 |
| 2020 | $2,354 | $220,240 | $52,143 | $168,097 |
| 2019 | $2,305 | $215,922 | $51,121 | $164,801 |
| 2018 | $2,270 | $211,689 | $50,119 | $161,570 |
| 2017 | $2,258 | $207,539 | $49,137 | $158,402 |
| 2016 | $2,257 | $203,471 | $48,174 | $155,297 |
| 2015 | $2,236 | $200,416 | $47,451 | $152,965 |
| 2014 | $2,094 | $196,491 | $46,522 | $149,969 |
Source: Public Records
Map
Nearby Homes
- 4928 Cummings Rd
- 2970 Pigeon Point Rd
- 4985 Cummings Rd
- 000 Spears Rd
- 3904 Wellington St
- 5423 Cummings Rd
- 2364 Ohio St
- 3010 Cedar Ln
- 4677 Mitchell Rd
- 3515 Mary Ct
- 2917 Wood Gulch Rd
- 3274 Montgomery St
- 5595 Cummings Rd
- 3219 18th St
- 2437 Bainbridge St
- 3979 Cedar St
- 2305 Harris St
- 2218 Harris St
- 1909 Harrison Ave
- 1790 Hill Ave
- 4522 Cummings Rd
- 5445 Cummings Rd
- 4545 Cummings Rd
- 4579 Cummings Rd
- 4660 Cummings Rd
- 4545 Cummings
- 4537 Cummings Rd
- 3573 Mitchell Rd
- 4535 Cummings Rd
- 3591 Mitchell Heights Dr
- 3584 Mitchell Heights Dr
- 3580 Mitchell Heights Dr
- 4695 Cummings Rd
- 3393 M St
- 3536 Mitchell Heights Dr
- 3547 Mitchell Heights Dr
- 3540 Mitchell Heights Dr
- 4692 Cummings Rd
- 3521 Mitchell Heights Dr
- 4717 Cummings Rd
Your Personal Tour Guide
Ask me questions while you tour the home.