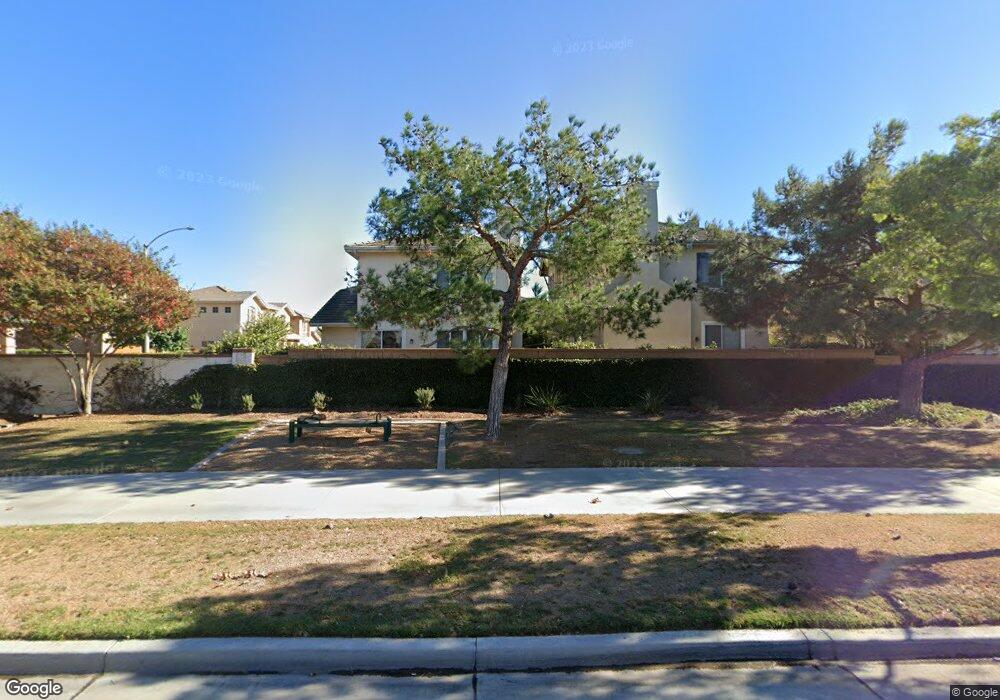
4580 Geraty Ct Unit 23 Riverside, CA 92505
La Sierra NeighborhoodEstimated Value: $545,204 - $613,000
3
Beds
3
Baths
1,532
Sq Ft
$381/Sq Ft
Est. Value
About This Home
This home is located at 4580 Geraty Ct Unit 23, Riverside, CA 92505 and is currently estimated at $584,301, approximately $381 per square foot. 4580 Geraty Ct Unit 23 is a home located in Riverside County with nearby schools including S. Christa Mcauliffe Elementary School, Ysmael Villegas Middle School, and La Sierra High School.
Ownership History
Date
Name
Owned For
Owner Type
Purchase Details
Closed on
Apr 9, 2015
Sold by
Nangia Sanjay
Bought by
Nangia Sapna S
Current Estimated Value
Home Financials for this Owner
Home Financials are based on the most recent Mortgage that was taken out on this home.
Original Mortgage
$203,700
Outstanding Balance
$116,271
Interest Rate
3.7%
Mortgage Type
New Conventional
Estimated Equity
$468,030
Purchase Details
Closed on
Sep 8, 2003
Sold by
Ghg Riverwalk Llc
Bought by
Ramchandani Sapna Naraindas
Home Financials for this Owner
Home Financials are based on the most recent Mortgage that was taken out on this home.
Original Mortgage
$244,165
Interest Rate
6.06%
Mortgage Type
Purchase Money Mortgage
Create a Home Valuation Report for This Property
The Home Valuation Report is an in-depth analysis detailing your home's value as well as a comparison with similar homes in the area
Home Values in the Area
Average Home Value in this Area
Purchase History
| Date | Buyer | Sale Price | Title Company |
|---|---|---|---|
| Nangia Sapna S | -- | First American Title Company | |
| Nangia Sapna S | -- | First American Title Company | |
| Ramchandani Sapna Naraindas | $257,500 | Investors Title Company |
Source: Public Records
Mortgage History
| Date | Status | Borrower | Loan Amount |
|---|---|---|---|
| Open | Nangia Sapna S | $203,700 | |
| Closed | Ramchandani Sapna Naraindas | $244,165 |
Source: Public Records
Tax History
| Year | Tax Paid | Tax Assessment Tax Assessment Total Assessment is a certain percentage of the fair market value that is determined by local assessors to be the total taxable value of land and additions on the property. | Land | Improvement |
|---|---|---|---|---|
| 2025 | $5,213 | $366,087 | $127,950 | $238,137 |
| 2023 | $5,213 | $351,874 | $122,983 | $228,891 |
| 2022 | $4,858 | $344,975 | $120,572 | $224,403 |
| 2021 | $4,761 | $338,211 | $118,208 | $220,003 |
| 2020 | $4,683 | $334,744 | $116,996 | $217,748 |
| 2019 | $4,611 | $328,181 | $114,702 | $213,479 |
| 2018 | $4,543 | $321,747 | $112,453 | $209,294 |
| 2017 | $4,447 | $315,440 | $110,249 | $205,191 |
| 2016 | $4,381 | $309,256 | $108,088 | $201,168 |
| 2015 | $4,319 | $304,613 | $106,465 | $198,148 |
| 2014 | $4,158 | $288,000 | $101,000 | $187,000 |
Source: Public Records
Map
Nearby Homes
- 4597 Bieber Ct
- 4581 Geraty Ct
- 11369 Brookglen Ct
- 11372 Riverpass Ct
- 11332 Riverbury Ct
- 4285 Gardendale Ct
- 11140 Bridgepoint Ct
- 4878 Streambay Ct
- 11141 Gardenhurst Ct
- 11306 Trailstone Ct
- 11327 Streamhurst Dr
- 11390 Parkfield Ct
- 11272 Doverwood Dr
- 0 Bushnell Ave
- 4247 Bravado
- 0 Blehm St
- 11571 Trailrun Ct
- 11494 Los Molinos Way
- 4389 Drexel Ave
- 11665 Valverda Ave
- 4591 Geraty Ct
- 11389 Creekmoor Ln Unit 27
- 11397 Creekmoor Ln
- 11393 Creekmoor Ln Unit 26
- 4607 Geraty Ct
- 4615 Geraty Ct
- 4589 Bieber Ct
- 11388 Creekmoor Ln
- 11355 Pond Ln
- 4573 Bieber Ct
- 4603 Olsen Ct
- 4627 Olsen Ct
- 4602 Olsen Ct
- 4635 Olsen Ct
- 11351 Pond Ln
- 11359 Pond Ln
- 11350 Pond Ln
- 4565 Bieber Ct
- 4611 Olsen Ct
- 11411 Brookscape Ln
Your Personal Tour Guide
Ask me questions while you tour the home.