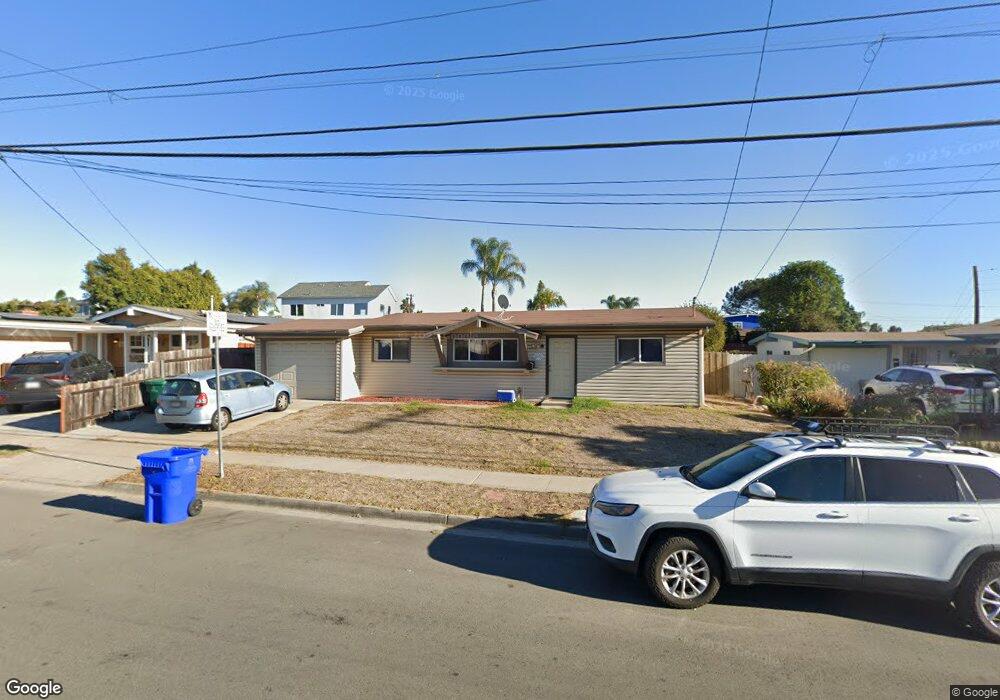
4581 Lyric Ln San Diego, CA 92117
Clairemont Mesa East NeighborhoodEstimated Value: $875,000 - $975,000
3
Beds
1
Bath
1,014
Sq Ft
$909/Sq Ft
Est. Value
About This Home
This home is located at 4581 Lyric Ln, San Diego, CA 92117 and is currently estimated at $921,840, approximately $909 per square foot. 4581 Lyric Ln is a home located in San Diego County with nearby schools including Sequoia Elementary School, Innovation Middle School, and Madison High School.
Ownership History
Date
Name
Owned For
Owner Type
Purchase Details
Closed on
Jun 27, 2025
Sold by
Yao You Jennivene
Bought by
Jesus And Jennivene Revocable Trust and Magusen
Current Estimated Value
Purchase Details
Closed on
Jul 16, 2015
Sold by
Spraker Steven C and Spraker Lynn J
Bought by
You Jennivene Yao
Home Financials for this Owner
Home Financials are based on the most recent Mortgage that was taken out on this home.
Original Mortgage
$346,000
Interest Rate
4.05%
Mortgage Type
New Conventional
Purchase Details
Closed on
Dec 21, 2011
Sold by
Spraker Steven C
Bought by
Spraker Steven C and Spraker Lynn J
Purchase Details
Closed on
Dec 20, 2011
Sold by
Spraker Kenneth J
Bought by
Spraker Kenneth J and Gilbert Spraker Louise
Purchase Details
Closed on
Oct 20, 2011
Sold by
Spraker Steven Charles
Bought by
Spraker Steven C and Spraker Kenneth J
Purchase Details
Closed on
May 24, 2007
Sold by
Spraker La Donna Mae
Bought by
Spraker La Donna M and Spraker Steven Charles
Create a Home Valuation Report for This Property
The Home Valuation Report is an in-depth analysis detailing your home's value as well as a comparison with similar homes in the area
Home Values in the Area
Average Home Value in this Area
Purchase History
| Date | Buyer | Sale Price | Title Company |
|---|---|---|---|
| Jesus And Jennivene Revocable Trust | -- | None Listed On Document | |
| You Jennivene Yao | $432,500 | Ticor Title San Diego | |
| Spraker Steven C | -- | None Available | |
| Spraker Kenneth J | -- | None Available | |
| Spraker Steven C | -- | None Available | |
| Spraker La Donna M | -- | None Available |
Source: Public Records
Mortgage History
| Date | Status | Borrower | Loan Amount |
|---|---|---|---|
| Previous Owner | You Jennivene Yao | $346,000 |
Source: Public Records
Tax History Compared to Growth
Tax History
| Year | Tax Paid | Tax Assessment Tax Assessment Total Assessment is a certain percentage of the fair market value that is determined by local assessors to be the total taxable value of land and additions on the property. | Land | Improvement |
|---|---|---|---|---|
| 2025 | $6,113 | $511,984 | $203,383 | $308,601 |
| 2024 | $6,113 | $501,946 | $199,396 | $302,550 |
| 2023 | $5,977 | $492,105 | $195,487 | $296,618 |
| 2022 | $5,816 | $482,456 | $191,654 | $290,802 |
| 2021 | $5,775 | $472,997 | $187,897 | $285,100 |
| 2020 | $5,704 | $468,148 | $185,971 | $282,177 |
| 2019 | $5,601 | $458,970 | $182,325 | $276,645 |
| 2018 | $5,236 | $449,971 | $178,750 | $271,221 |
| 2017 | $5,110 | $441,149 | $175,246 | $265,903 |
| 2016 | $5,026 | $432,500 | $171,810 | $260,690 |
| 2015 | $557 | $44,939 | $17,852 | $27,087 |
| 2014 | $550 | $44,060 | $17,503 | $26,557 |
Source: Public Records
Map
Nearby Homes
- 5113 Bellvale Ave
- 5404 Balboa Arms Dr Unit 461
- 5402 Balboa Arms Dr Unit 345
- 5402 Balboa Arms Dr Unit 415
- 5252 Balboa Arms Dr Unit 180
- 5252 Balboa Arms Dr Unit 171
- 5715 Castleton Dr
- 5061 Canosa Ave
- 5656 Chandler Dr
- 5768 Camber Dr
- 5783 Camber Dr
- 4979 Acuna St
- 5124 Acuna St
- 4827 Rushden Ave
- 4833 Chateau Dr
- 4716 Mount Cervin Dr
- 5919 Lana Dr
- 5170 Clairemont Mesa Blvd Unit 8
- 5170 Clairemont Mesa Blvd Unit 27
- 4261 Cannington Dr
- 4589 Lyric Ln
- 4573 Lyric Ln
- 4520 Limerick Way
- 4530 Limerick Way
- 4510 Limerick Way
- 4597 Lyric Ln
- 4582 Lyric Ln
- 4540 Limerick Way
- 4576 Lyric Ln
- 5177 Bellvale Ave
- 4601 Lyric Ln
- 4557 Lyric Ln
- 4554 Limerick Way
- 4476 Limerick Way
- 5171 Bellvale Ave
- 4605 Lyric Ln
- 5190 Bowden Ave
- 4549 Lyric Ln
- 4523 Limerick Way
- 4560 Lyric Ln