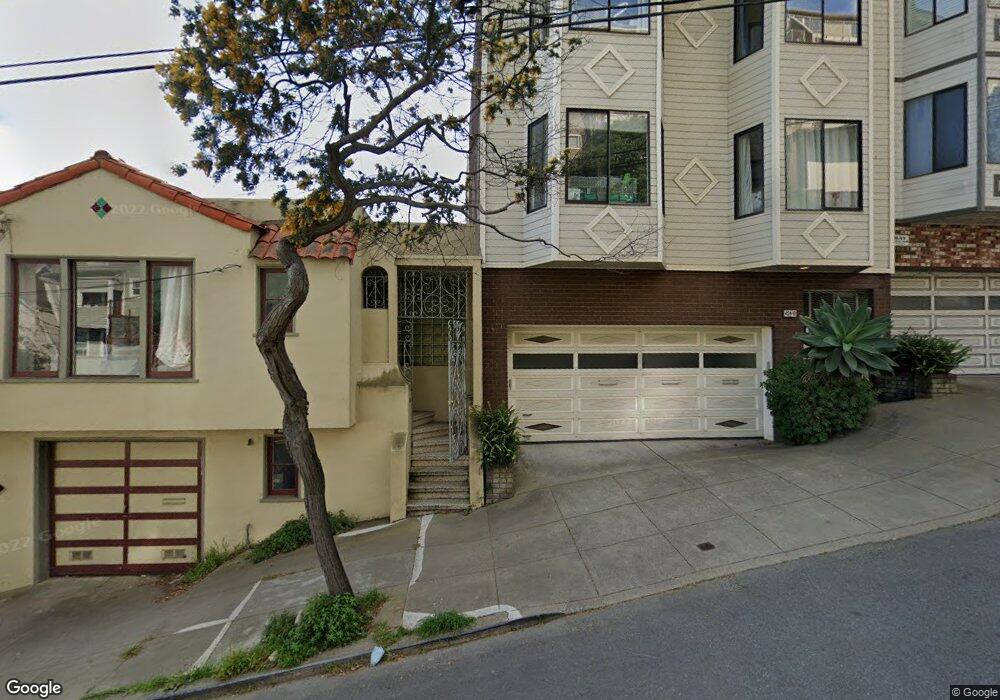
459 28th St Unit 461 San Francisco, CA 94131
Noe Valley NeighborhoodEstimated Value: $2,728,000 - $3,210,939
6
Beds
4
Baths
4,199
Sq Ft
$701/Sq Ft
Est. Value
About This Home
This home is located at 459 28th St Unit 461, San Francisco, CA 94131 and is currently estimated at $2,941,735, approximately $700 per square foot. 459 28th St Unit 461 is a home located in San Francisco County with nearby schools including Alvarado Elementary, James Lick Middle School, and St. Philip School.
Ownership History
Date
Name
Owned For
Owner Type
Purchase Details
Closed on
Dec 21, 2012
Sold by
Dea David and Chew Doris
Bought by
Dea David and Chew Doris
Current Estimated Value
Home Financials for this Owner
Home Financials are based on the most recent Mortgage that was taken out on this home.
Original Mortgage
$373,000
Outstanding Balance
$257,208
Interest Rate
3.27%
Mortgage Type
Commercial
Estimated Equity
$2,684,527
Purchase Details
Closed on
Jun 1, 1998
Sold by
Dea David and Chew Doris
Bought by
Dea David and Chew Doris
Purchase Details
Closed on
Oct 30, 1997
Sold by
Case Roger A and Mcqueen Charlotte J
Bought by
Dea David and Chew Doris
Home Financials for this Owner
Home Financials are based on the most recent Mortgage that was taken out on this home.
Original Mortgage
$470,000
Interest Rate
8%
Mortgage Type
Commercial
Create a Home Valuation Report for This Property
The Home Valuation Report is an in-depth analysis detailing your home's value as well as a comparison with similar homes in the area
Home Values in the Area
Average Home Value in this Area
Purchase History
| Date | Buyer | Sale Price | Title Company |
|---|---|---|---|
| Dea David | -- | Fidelity National Title Co | |
| Dea David | -- | Fidelity National Title Co | |
| Dea David | -- | -- | |
| Dea David | $845,000 | First American Title Co |
Source: Public Records
Mortgage History
| Date | Status | Borrower | Loan Amount |
|---|---|---|---|
| Open | Dea David | $373,000 | |
| Closed | Dea David | $470,000 |
Source: Public Records
Tax History Compared to Growth
Tax History
| Year | Tax Paid | Tax Assessment Tax Assessment Total Assessment is a certain percentage of the fair market value that is determined by local assessors to be the total taxable value of land and additions on the property. | Land | Improvement |
|---|---|---|---|---|
| 2025 | $16,285 | $1,349,250 | $674,625 | $674,625 |
| 2024 | $16,285 | $1,322,796 | $661,398 | $661,398 |
| 2023 | $16,039 | $1,296,860 | $648,430 | $648,430 |
| 2022 | $15,732 | $1,271,432 | $635,716 | $635,716 |
| 2021 | $15,453 | $1,246,502 | $623,251 | $623,251 |
| 2020 | $15,526 | $1,233,722 | $616,861 | $616,861 |
| 2019 | $14,994 | $1,209,532 | $604,766 | $604,766 |
| 2018 | $14,490 | $1,185,816 | $592,908 | $592,908 |
| 2017 | $14,021 | $1,162,566 | $581,283 | $581,283 |
| 2016 | $13,792 | $1,139,772 | $569,886 | $569,886 |
| 2015 | $13,622 | $1,122,652 | $561,326 | $561,326 |
| 2014 | $13,263 | $1,100,662 | $550,331 | $550,331 |
Source: Public Records
Map
Nearby Homes