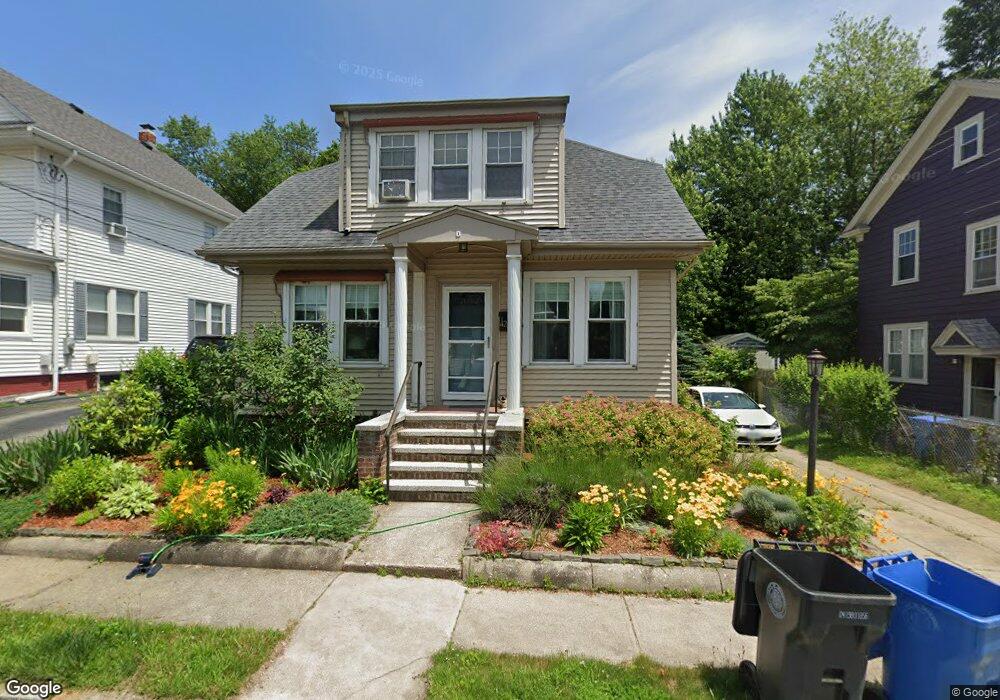
46 Bow St Cranston, RI 02905
Edgewood NeighborhoodEstimated Value: $416,313 - $544,000
3
Beds
1
Bath
1,475
Sq Ft
$319/Sq Ft
Est. Value
About This Home
This home is located at 46 Bow St, Cranston, RI 02905 and is currently estimated at $471,078, approximately $319 per square foot. 46 Bow St is a home located in Providence County with nearby schools including Edward S. Rhodes School, Park View Middle School, and Cranston High School East.
Ownership History
Date
Name
Owned For
Owner Type
Purchase Details
Closed on
Sep 25, 1997
Sold by
Erickson William B and Erickson Deborah
Bought by
Rosenberg Karen B
Current Estimated Value
Home Financials for this Owner
Home Financials are based on the most recent Mortgage that was taken out on this home.
Original Mortgage
$80,850
Outstanding Balance
$12,530
Interest Rate
7.47%
Estimated Equity
$458,548
Purchase Details
Closed on
Jan 30, 1995
Sold by
Ferland Alan G
Bought by
Erickson William B and Erickson Deborah
Purchase Details
Closed on
Sep 1, 1993
Sold by
Lavallee Linda P
Bought by
Ferland Alan G
Home Financials for this Owner
Home Financials are based on the most recent Mortgage that was taken out on this home.
Original Mortgage
$103,257
Interest Rate
7.11%
Create a Home Valuation Report for This Property
The Home Valuation Report is an in-depth analysis detailing your home's value as well as a comparison with similar homes in the area
Home Values in the Area
Average Home Value in this Area
Purchase History
| Date | Buyer | Sale Price | Title Company |
|---|---|---|---|
| Rosenberg Karen B | $116,000 | -- | |
| Erickson William B | $109,000 | -- | |
| Ferland Alan G | $103,000 | -- |
Source: Public Records
Mortgage History
| Date | Status | Borrower | Loan Amount |
|---|---|---|---|
| Open | Ferland Alan G | $80,850 | |
| Previous Owner | Ferland Alan G | $103,257 |
Source: Public Records
Tax History Compared to Growth
Tax History
| Year | Tax Paid | Tax Assessment Tax Assessment Total Assessment is a certain percentage of the fair market value that is determined by local assessors to be the total taxable value of land and additions on the property. | Land | Improvement |
|---|---|---|---|---|
| 2025 | $4,443 | $320,100 | $106,700 | $213,400 |
| 2024 | $4,357 | $320,100 | $106,700 | $213,400 |
| 2023 | $4,232 | $223,900 | $70,300 | $153,600 |
| 2022 | $4,144 | $223,900 | $70,300 | $153,600 |
| 2021 | $4,030 | $223,900 | $70,300 | $153,600 |
| 2020 | $3,774 | $181,700 | $66,900 | $114,800 |
| 2019 | $3,774 | $181,700 | $66,900 | $114,800 |
| 2018 | $3,687 | $181,700 | $66,900 | $114,800 |
| 2017 | $3,540 | $154,300 | $60,200 | $94,100 |
| 2016 | $3,464 | $154,300 | $60,200 | $94,100 |
| 2015 | $3,464 | $154,300 | $60,200 | $94,100 |
| 2014 | $3,408 | $149,200 | $60,200 | $89,000 |
Source: Public Records
Map
Nearby Homes
- 14 Park Ave
- 28 Sylvan Ave
- 10 Sylvan Ave
- 27 Cliffdale Ave
- 68 Cliffdale Ave
- 126 Columbia Ave
- 19 Warwick Ave
- 42 Netherlands Ave
- 177 Arnold Ave
- 112 Villa Ave
- 98 Columbia Ave
- 51 Columbia Ave
- 1291 Narragansett Blvd Unit 4
- 114 Norwood Ave
- 22 Community Dr
- 15 Wheeler Ave
- 88 Wentworth Ave
- 94 Holmes Rd
- 345 Post Rd
- 0 Holmes Rd