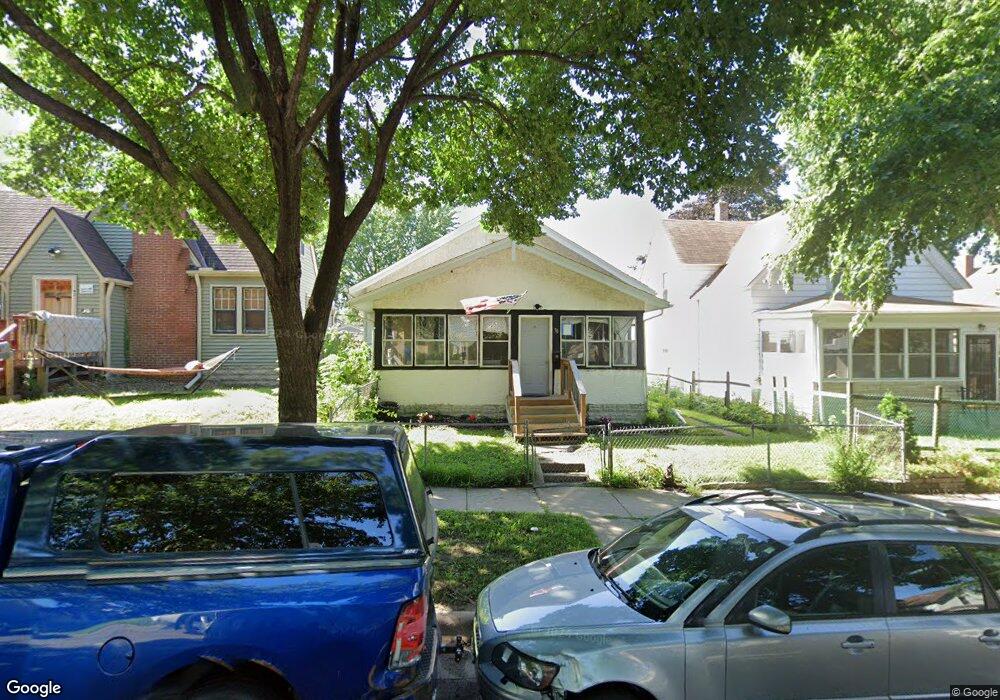
46 Hatch Ave Saint Paul, MN 55117
North End NeighborhoodEstimated Value: $192,000 - $204,591
3
Beds
1
Bath
1,192
Sq Ft
$166/Sq Ft
Est. Value
About This Home
This home is located at 46 Hatch Ave, Saint Paul, MN 55117 and is currently estimated at $198,148, approximately $166 per square foot. 46 Hatch Ave is a home located in Ramsey County with nearby schools including Bruce F Vento Elementary School, Washington Technology Magnet School, and Community School of Excellence.
Ownership History
Date
Name
Owned For
Owner Type
Purchase Details
Closed on
Jul 21, 2017
Sold by
Vang Khou
Bought by
Zhou Xin
Current Estimated Value
Home Financials for this Owner
Home Financials are based on the most recent Mortgage that was taken out on this home.
Original Mortgage
$87,800
Outstanding Balance
$73,087
Interest Rate
3.96%
Mortgage Type
New Conventional
Estimated Equity
$125,061
Purchase Details
Closed on
Apr 19, 1999
Sold by
Estate Of Edith L Swanson
Bought by
Berrisford Charity C and Benson Gary A
Create a Home Valuation Report for This Property
The Home Valuation Report is an in-depth analysis detailing your home's value as well as a comparison with similar homes in the area
Home Values in the Area
Average Home Value in this Area
Purchase History
| Date | Buyer | Sale Price | Title Company |
|---|---|---|---|
| Zhou Xin | $109,800 | Partners Title Llc | |
| Vang Khou | -- | Partners Title Llc | |
| Berrisford Charity C | $67,900 | -- |
Source: Public Records
Mortgage History
| Date | Status | Borrower | Loan Amount |
|---|---|---|---|
| Open | Zhou Xin | $87,800 |
Source: Public Records
Tax History
| Year | Tax Paid | Tax Assessment Tax Assessment Total Assessment is a certain percentage of the fair market value that is determined by local assessors to be the total taxable value of land and additions on the property. | Land | Improvement |
|---|---|---|---|---|
| 2025 | $2,970 | $185,200 | $25,000 | $160,200 |
| 2023 | $2,970 | $186,100 | $20,000 | $166,100 |
| 2022 | $2,394 | $175,700 | $20,000 | $155,700 |
| 2021 | $2,312 | $144,300 | $20,000 | $124,300 |
| 2020 | $2,276 | $144,500 | $10,400 | $134,100 |
| 2019 | $1,700 | $132,100 | $10,400 | $121,700 |
| 2018 | $848 | $96,200 | $10,400 | $85,800 |
| 2017 | $696 | $74,000 | $10,400 | $63,600 |
| 2016 | $746 | $0 | $0 | $0 |
| 2015 | $614 | $66,300 | $10,400 | $55,900 |
| 2014 | $732 | $0 | $0 | $0 |
Source: Public Records
Map
Nearby Homes
- 101 Manitoba Ave
- 89 Winnipeg Ave
- 46 Winnipeg Ave
- 36 Winnipeg Ave
- 922 N Woodbridge St
- 48 Jessamine Ave E
- 71 Magnolia Ave E
- 823 Hardenbergh Place
- 821 Hardenbergh Place
- 102 Geranium Ave W
- 137 Sims Ave
- 1098 Woodbridge St
- 997 Marion St
- 1136 Albemarle St
- 903 Marion St
- 137 Cayuga St
- 1122 Jackson St
- 16 Sycamore St E
- 23 Acker St W
- 9 Acker St W
Your Personal Tour Guide
Ask me questions while you tour the home.