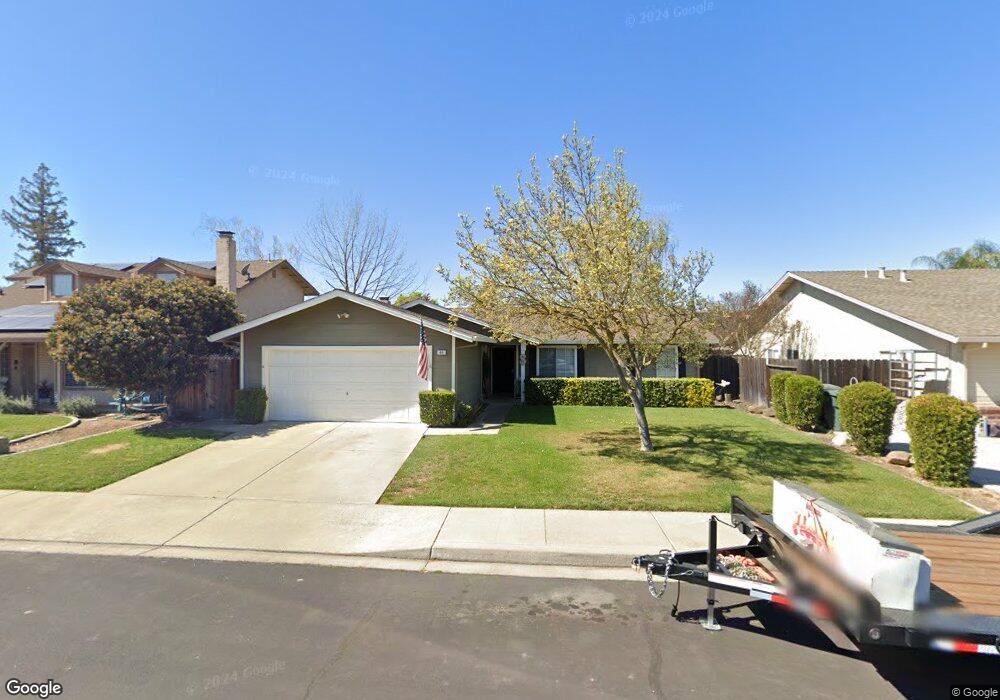
46 Obsidian Dr Oakdale, CA 95361
Estimated Value: $449,734 - $484,000
3
Beds
2
Baths
1,503
Sq Ft
$310/Sq Ft
Est. Value
About This Home
This home is located at 46 Obsidian Dr, Oakdale, CA 95361 and is currently estimated at $466,184, approximately $310 per square foot. 46 Obsidian Dr is a home located in Stanislaus County with nearby schools including Fair Oaks Elementary School, Oakdale Junior High School, and East Stanislaus High School.
Ownership History
Date
Name
Owned For
Owner Type
Purchase Details
Closed on
Aug 16, 2007
Sold by
Szelenyi Mark R and Szelenyi Janet M
Bought by
Szelenyi Mark R and Szelenyi Janet M
Current Estimated Value
Purchase Details
Closed on
Dec 1, 2003
Sold by
Thompson Matthew Alan and Thompson Kimberli Ann
Bought by
Szelenyi Mark and Szelenyi Janet M
Home Financials for this Owner
Home Financials are based on the most recent Mortgage that was taken out on this home.
Original Mortgage
$187,000
Outstanding Balance
$73,618
Interest Rate
3.85%
Mortgage Type
Negative Amortization
Estimated Equity
$392,566
Purchase Details
Closed on
Sep 11, 2000
Sold by
Burgett Alice M
Bought by
Thompson Matthew Alan and Thompson Kimberli Ann
Home Financials for this Owner
Home Financials are based on the most recent Mortgage that was taken out on this home.
Original Mortgage
$148,760
Interest Rate
8.11%
Mortgage Type
VA
Create a Home Valuation Report for This Property
The Home Valuation Report is an in-depth analysis detailing your home's value as well as a comparison with similar homes in the area
Home Values in the Area
Average Home Value in this Area
Purchase History
| Date | Buyer | Sale Price | Title Company |
|---|---|---|---|
| Szelenyi Mark R | -- | None Available | |
| Szelenyi Mark R | -- | None Available | |
| Szelenyi Mark | $234,000 | Chicago Title | |
| Thompson Matthew Alan | $148,000 | Fidelity National Title Co |
Source: Public Records
Mortgage History
| Date | Status | Borrower | Loan Amount |
|---|---|---|---|
| Open | Szelenyi Mark | $187,000 | |
| Previous Owner | Thompson Matthew Alan | $148,760 |
Source: Public Records
Tax History
| Year | Tax Paid | Tax Assessment Tax Assessment Total Assessment is a certain percentage of the fair market value that is determined by local assessors to be the total taxable value of land and additions on the property. | Land | Improvement |
|---|---|---|---|---|
| 2025 | $3,713 | $332,684 | $113,735 | $218,949 |
| 2024 | $3,521 | $326,161 | $111,505 | $214,656 |
| 2023 | $3,447 | $319,767 | $109,319 | $210,448 |
| 2022 | $3,388 | $313,498 | $107,176 | $206,322 |
| 2021 | $3,332 | $307,352 | $105,075 | $202,277 |
| 2020 | $3,295 | $304,201 | $103,998 | $200,203 |
| 2019 | $3,246 | $298,237 | $101,959 | $196,278 |
| 2018 | $3,201 | $292,390 | $99,960 | $192,430 |
| 2017 | $3,145 | $286,657 | $98,000 | $188,657 |
| 2016 | $3,090 | $281,037 | $96,079 | $184,958 |
| 2015 | $2,734 | $248,000 | $58,500 | $189,500 |
| 2014 | $2,362 | $212,000 | $50,000 | $162,000 |
Source: Public Records
Map
Nearby Homes
- 2134 Navajo Ct
- 2337 Rainwood Ln
- 1957 Blue Spruce Dr
- 366 Romano Way
- 1879 Silvio Way
- 1810 Silvio Way
- 0 Odessa Way Unit 226014449
- 206 S Lee Ave
- 549 Fresian Dr
- 2153 Saddlebrook Way
- 2532 Laurel Ridge Ct
- 2848 Westport Cir
- 2370 Shire Way
- 2908 Westport Cir
- 1766 Churchill Downs Cir
- 1500 Walnut St
- 174 Warrington Ave
- 562 Ranger St
- 332 Hinkley Ave
- 561 Branding Iron St
Your Personal Tour Guide
Ask me questions while you tour the home.