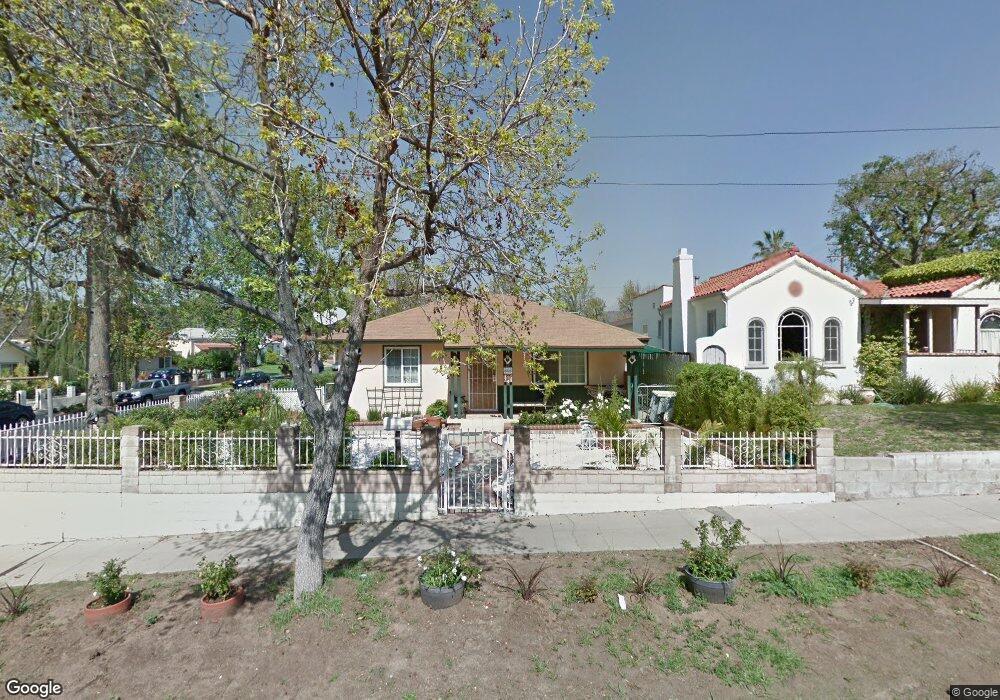
4601 Paulhan Ave Los Angeles, CA 90041
Eagle Rock NeighborhoodEstimated Value: $1,016,000 - $1,262,908
2
Beds
1
Bath
1,241
Sq Ft
$921/Sq Ft
Est. Value
About This Home
This home is located at 4601 Paulhan Ave, Los Angeles, CA 90041 and is currently estimated at $1,143,227, approximately $921 per square foot. 4601 Paulhan Ave is a home located in Los Angeles County with nearby schools including Toland Way Elementary School, Eagle Rock High School, and Irving STEAM Magnet School.
Ownership History
Date
Name
Owned For
Owner Type
Purchase Details
Closed on
Dec 11, 2017
Sold by
Macalino Cesar
Bought by
Goodbody Nicholas Toll and Vargas Myriam Yovanna Cifuentes
Current Estimated Value
Home Financials for this Owner
Home Financials are based on the most recent Mortgage that was taken out on this home.
Original Mortgage
$524,000
Outstanding Balance
$440,934
Interest Rate
3.92%
Mortgage Type
New Conventional
Estimated Equity
$702,293
Purchase Details
Closed on
Jun 6, 2000
Sold by
Macalino Cesar
Bought by
Macalino Cesar and Macalino Zenaida D
Home Financials for this Owner
Home Financials are based on the most recent Mortgage that was taken out on this home.
Original Mortgage
$172,081
Interest Rate
8.08%
Mortgage Type
FHA
Purchase Details
Closed on
May 9, 2000
Sold by
Ngo Thanh Van Gdn
Bought by
Macalino Ceasar
Home Financials for this Owner
Home Financials are based on the most recent Mortgage that was taken out on this home.
Original Mortgage
$172,081
Interest Rate
8.08%
Mortgage Type
FHA
Create a Home Valuation Report for This Property
The Home Valuation Report is an in-depth analysis detailing your home's value as well as a comparison with similar homes in the area
Home Values in the Area
Average Home Value in this Area
Purchase History
| Date | Buyer | Sale Price | Title Company |
|---|---|---|---|
| Goodbody Nicholas Toll | $655,000 | North American Title Company | |
| Macalino Cesar | -- | -- | |
| Macalino Ceasar | $173,500 | Commonwealth Land Title Co | |
| Macalino Cesar | -- | Commonwealth Title |
Source: Public Records
Mortgage History
| Date | Status | Borrower | Loan Amount |
|---|---|---|---|
| Open | Goodbody Nicholas Toll | $524,000 | |
| Previous Owner | Macalino Ceasar | $172,081 |
Source: Public Records
Tax History Compared to Growth
Tax History
| Year | Tax Paid | Tax Assessment Tax Assessment Total Assessment is a certain percentage of the fair market value that is determined by local assessors to be the total taxable value of land and additions on the property. | Land | Improvement |
|---|---|---|---|---|
| 2025 | $9,770 | $816,508 | $596,219 | $220,289 |
| 2024 | $9,770 | $800,499 | $584,529 | $215,970 |
| 2023 | $9,580 | $784,804 | $573,068 | $211,736 |
| 2022 | $9,131 | $769,417 | $561,832 | $207,585 |
| 2021 | $9,019 | $754,331 | $550,816 | $203,515 |
| 2019 | $8,746 | $731,960 | $534,480 | $197,480 |
| 2018 | $2,924 | $234,346 | $146,284 | $88,062 |
| 2016 | $2,705 | $225,248 | $140,604 | $84,644 |
| 2015 | $2,666 | $221,865 | $138,492 | $83,373 |
| 2014 | $2,680 | $217,520 | $135,780 | $81,740 |
Source: Public Records
Map
Nearby Homes
- 1607 Campus Rd
- 1747 N Avenue 46
- 2161 Ridgeview Ave
- 2402 Langdale Ave
- 4666 York Blvd
- 2035 Las Colinas Ave
- 1745 College View Place
- 2215 Norwalk Ave
- 2536 Medlow Ave
- 4654 Toland Way
- 4707 Toland Way
- 2633 Medlow Ave
- 3832 W Avenue 43 Unit 5
- 1336 Armadale Ave
- 1553 Verbena Way
- 2655 Saxon Dr
- 1950 Yosemite Dr
- 2222 1/2 Strata Ln
- 2101 Yosemite Dr
- 4500 Mont Eagle Place
- 4607 Paulhan Ave
- 1664 N Avenue 46
- 4613 Paulhan Ave
- 1668 N Avenue 46
- 4617 Paulhan Ave
- 4575 Paulhan Ave
- 1657 N Avenue 46
- 1663 N Avenue 46
- 1622 N Avenue 46
- 4610 Paulhan Ave
- 4606 Corliss St
- 4620 Paulhan Ave
- 4600 Corliss St
- 1669 N Avenue 46
- 1665 N Avenue 46
- 4610 Corliss St
- 4576 Paulhan Ave
- 4614 Corliss St
- 1616 N Avenue 46
- 1673 N Avenue 46