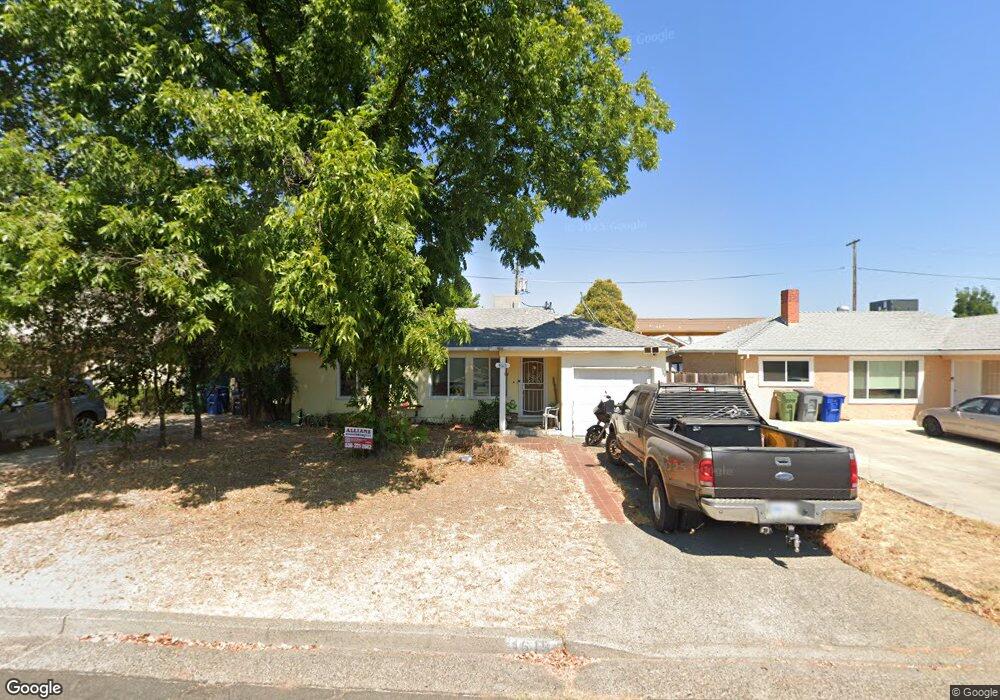
4615 Harrison Ave Redding, CA 96001
Country Heights NeighborhoodEstimated Value: $205,000 - $237,000
2
Beds
1
Bath
820
Sq Ft
$268/Sq Ft
Est. Value
About This Home
This home is located at 4615 Harrison Ave, Redding, CA 96001 and is currently estimated at $219,364, approximately $267 per square foot. 4615 Harrison Ave is a home located in Shasta County with nearby schools including Sycamore Elementary School, Sequoia Middle School, and Shasta High School.
Ownership History
Date
Name
Owned For
Owner Type
Purchase Details
Closed on
Oct 5, 2021
Sold by
Nash Krystal R
Bought by
Atkins Barbara J and Atkins James B
Current Estimated Value
Home Financials for this Owner
Home Financials are based on the most recent Mortgage that was taken out on this home.
Original Mortgage
$191,090
Outstanding Balance
$174,256
Interest Rate
2.8%
Mortgage Type
New Conventional
Estimated Equity
$45,108
Purchase Details
Closed on
May 9, 2005
Sold by
Douse Richard T and Douse Tammy K
Bought by
Reitemeyer Krystal R
Home Financials for this Owner
Home Financials are based on the most recent Mortgage that was taken out on this home.
Original Mortgage
$143,200
Interest Rate
7.55%
Mortgage Type
Fannie Mae Freddie Mac
Purchase Details
Closed on
Jan 25, 2005
Sold by
Douse Richard T and Douse Tammy K
Bought by
Douse Richard T and Douse Tammy K
Purchase Details
Closed on
Sep 16, 2004
Sold by
Bendroth Karl M
Bought by
Douse Richard T and Douse Tammy K
Create a Home Valuation Report for This Property
The Home Valuation Report is an in-depth analysis detailing your home's value as well as a comparison with similar homes in the area
Home Values in the Area
Average Home Value in this Area
Purchase History
| Date | Buyer | Sale Price | Title Company |
|---|---|---|---|
| Atkins Barbara J | $197,000 | First American Title Company | |
| Nash Krystal R | -- | First American Title Company | |
| Nash Krystal R | -- | First American Title Company | |
| Reitemeyer Krystal R | $179,000 | Fidelity Natl Title Co Of Ca | |
| Douse Richard T | -- | Fidelity Natl Title Co Of Ca | |
| Douse Richard T | -- | -- | |
| Douse Richard T | -- | -- |
Source: Public Records
Mortgage History
| Date | Status | Borrower | Loan Amount |
|---|---|---|---|
| Open | Atkins Barbara J | $191,090 | |
| Previous Owner | Reitemeyer Krystal R | $143,200 | |
| Closed | Reitemeyer Krystal R | $35,800 |
Source: Public Records
Tax History
| Year | Tax Paid | Tax Assessment Tax Assessment Total Assessment is a certain percentage of the fair market value that is determined by local assessors to be the total taxable value of land and additions on the property. | Land | Improvement |
|---|---|---|---|---|
| 2025 | $2,178 | $209,056 | $37,142 | $171,914 |
| 2024 | $2,145 | $204,958 | $36,414 | $168,544 |
| 2023 | $2,145 | $200,940 | $35,700 | $165,240 |
| 2022 | $2,109 | $197,000 | $35,000 | $162,000 |
| 2021 | $1,958 | $180,000 | $30,000 | $150,000 |
| 2020 | $1,840 | $165,000 | $30,000 | $135,000 |
| 2019 | $1,623 | $150,000 | $35,000 | $115,000 |
| 2018 | $1,397 | $125,000 | $40,000 | $85,000 |
| 2017 | $1,218 | $107,100 | $45,000 | $62,100 |
| 2016 | $1,180 | $105,000 | $45,000 | $60,000 |
| 2015 | $1,062 | $94,000 | $40,000 | $54,000 |
| 2014 | $908 | $79,000 | $35,000 | $44,000 |
Source: Public Records
Map
Nearby Homes
- 4549 Harrison Ave
- 2230 El Reno Ln
- 4410 Westside Rd
- 2340 Wilsey Dr
- 4920 Bonnyview Ave
- 4540 Cerro Ln
- 2415 Marion Ct
- 0 Lot4 Unit 2 Ph 2 Stillwater Unit 25-4962
- 0 Lot3 Unit 2 Ph 2 Stillwater Unit 25-4961
- 0 Lot6 Unit 2 Ph 2 Stillwater Unit 25-4964
- 0 Lot5 Unit 2 Ph 2 Stillwater Unit 25-4963
- 0 Lot16 Unit 2 Ph 2 Stillwater Unit 25-4958
- 0 Lot9 Unit 2 Ph 2 Stillwater Unit 25-4967
- 0 Lot2 Unit 2 Ph 2 Stillwater Unit 25-4960
- 0 Lot11 Unit 2 Ph 2 Stillwater Unit 25-4953
- 0 Lot10 Unit 2 Ph 2 Stillwater Unit 25-4952
- 0 Lot7 Unit 2 Ph 2 Stillwater Unit 25-4965
- 0000 Wyndham Pointe Subdivision
- 3660-3671 Technology Way
- 3817 Thea Dr
- 4627 Harrison Ave
- 4605 Harrison Ave
- 4637 Harrison Ave
- 4593 Harrison Ave
- 4579 Harrison Ave
- 4614 Harrison Ave
- 4626 Harrison Ave
- 4604 Harrison Ave
- 4592 Harrison Ave
- 4636 Harrison Ave
- 4646 Harrison Ave
- 4655 Harrison Ave
- 4569 Harrison Ave
- 4578 Harrison Ave
- 4654 Harrison Ave
- 4559 Harrison Ave
- 4568 Harrison Ave
- 4675 Harrison Ave Unit 1
- 4675 Harrison Ave
- 4664 Harrison Ave
Your Personal Tour Guide
Ask me questions while you tour the home.