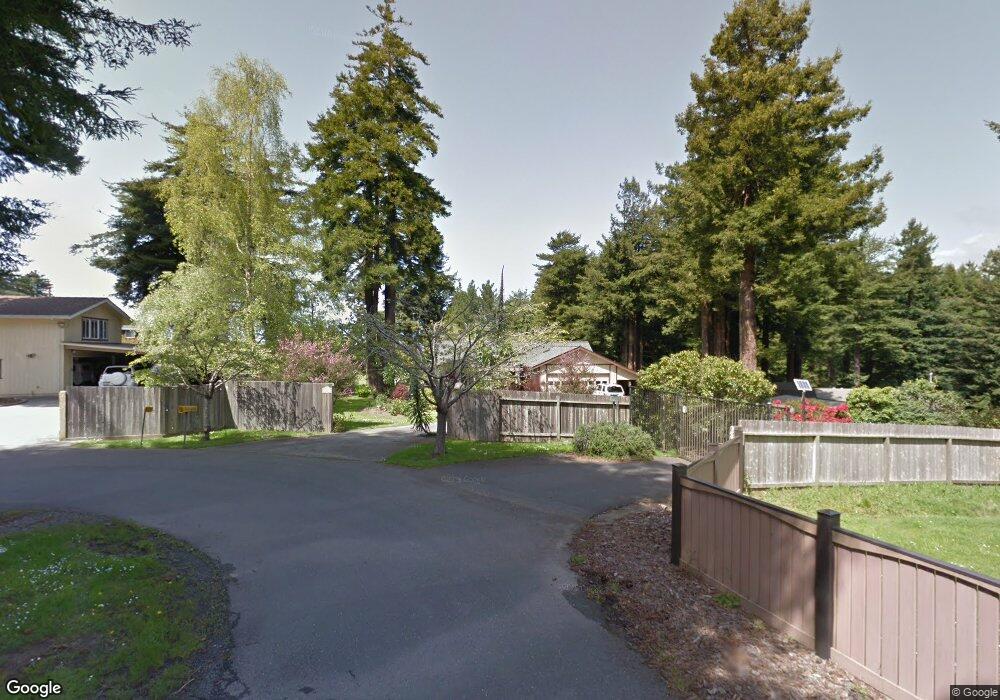
4619 Florence Place Eureka, CA 95503
Estimated Value: $589,032 - $673,000
3
Beds
2
Baths
1,850
Sq Ft
$342/Sq Ft
Est. Value
About This Home
This home is located at 4619 Florence Place, Eureka, CA 95503 and is currently estimated at $633,258, approximately $342 per square foot. 4619 Florence Place is a home located in Humboldt County with nearby schools including Freshwater Elementary School, Mistwood Montessori School, and Gospel Outreach School.
Ownership History
Date
Name
Owned For
Owner Type
Purchase Details
Closed on
Jul 19, 2017
Sold by
Goosby Zuretti L and Goosby Brenda A
Bought by
Goosby Zuretti Lee and Goosby Brenda Ann
Current Estimated Value
Purchase Details
Closed on
Jun 2, 2010
Sold by
Goosby Brenda A and Goosby Zuretti L
Bought by
Goosby Zuretti L and Goosby Brenda A
Home Financials for this Owner
Home Financials are based on the most recent Mortgage that was taken out on this home.
Original Mortgage
$230,000
Interest Rate
5.05%
Mortgage Type
New Conventional
Purchase Details
Closed on
Mar 24, 2005
Sold by
Goosby Zuretti and Morgan Brenda
Bought by
Goosby Zuretti L and Goosby Brenda A
Purchase Details
Closed on
Jul 12, 2004
Sold by
Peoples James L and Peoples Carmen R
Bought by
Goosby Zuretti and Morgan Brenda
Home Financials for this Owner
Home Financials are based on the most recent Mortgage that was taken out on this home.
Original Mortgage
$250,000
Interest Rate
6.29%
Mortgage Type
Purchase Money Mortgage
Create a Home Valuation Report for This Property
The Home Valuation Report is an in-depth analysis detailing your home's value as well as a comparison with similar homes in the area
Purchase History
| Date | Buyer | Sale Price | Title Company |
|---|---|---|---|
| Goosby Zuretti Lee | -- | None Available | |
| Goosby Zuretti L | -- | First American Title Company | |
| Goosby Zuretti L | -- | -- | |
| Goosby Zuretti | $412,000 | Humboldt Land Title Company |
Source: Public Records
Mortgage History
| Date | Status | Borrower | Loan Amount |
|---|---|---|---|
| Closed | Goosby Zuretti L | $230,000 | |
| Closed | Goosby Zuretti | $250,000 | |
| Closed | Goosby Zuretti | $60,000 |
Source: Public Records
Tax History
| Year | Tax Paid | Tax Assessment Tax Assessment Total Assessment is a certain percentage of the fair market value that is determined by local assessors to be the total taxable value of land and additions on the property. | Land | Improvement |
|---|---|---|---|---|
| 2025 | $5,795 | $558,939 | $252,288 | $306,651 |
| 2024 | $5,795 | $547,981 | $247,342 | $300,639 |
| 2023 | $5,666 | $537,238 | $242,493 | $294,745 |
| 2022 | $5,877 | $526,705 | $237,739 | $288,966 |
| 2021 | $5,507 | $516,378 | $233,078 | $283,300 |
| 2020 | $5,466 | $511,085 | $230,689 | $280,396 |
| 2019 | $5,354 | $501,065 | $226,166 | $274,899 |
| 2018 | $5,273 | $491,241 | $221,732 | $269,509 |
| 2017 | $5,245 | $481,610 | $217,385 | $264,225 |
| 2016 | $5,245 | $472,168 | $213,123 | $259,045 |
| 2015 | $5,198 | $465,076 | $209,922 | $255,154 |
| 2014 | $4,862 | $455,966 | $205,810 | $250,156 |
Source: Public Records
Map
Nearby Homes
- 000 Spears Rd
- 2970 Pigeon Point Rd
- 4928 Cummings Rd
- 4985 Cummings Rd
- 3904 Wellington St
- 2364 Ohio St
- 5423 Cummings Rd
- 3010 Cedar Ln
- 2917 Wood Gulch Rd
- 3219 18th St
- 4677 Mitchell Rd
- 3515 Mary Ct
- 3274 Montgomery St
- 5595 Cummings Rd
- 2437 Bainbridge St
- 1909 Harrison Ave
- 1790 Hill Ave
- 2305 Harris St
- 3979 Cedar St
- 2218 Harris St
- 3369 Mitchell Heights Dr
- 4655 Florence Place
- 3389 Mitchell Heights Dr
- 3447 Mitchell Heights Dr
- 3351 Mitchell Heights Dr
- 4622 Florence Place
- 4622 Florence Place
- 3309 Mitchell Heights Dr
- 4600 Florence Place
- 3390 Mitchell Heights Dr
- 3519 Mitchell Heights Dr
- 3535 Mitchell Heights Dr
- 3531 Mitchell Heights Dr
- 3521 Mitchell Heights Dr
- 3277 Mitchell Heights Dr
- 3316 Mitchell Heights Dr
- 4750 Westwing Ln
- 3253 Mitchell Heights Dr
- 3260 Mitchell Heights Dr
- 3045 Main St
Your Personal Tour Guide
Ask me questions while you tour the home.