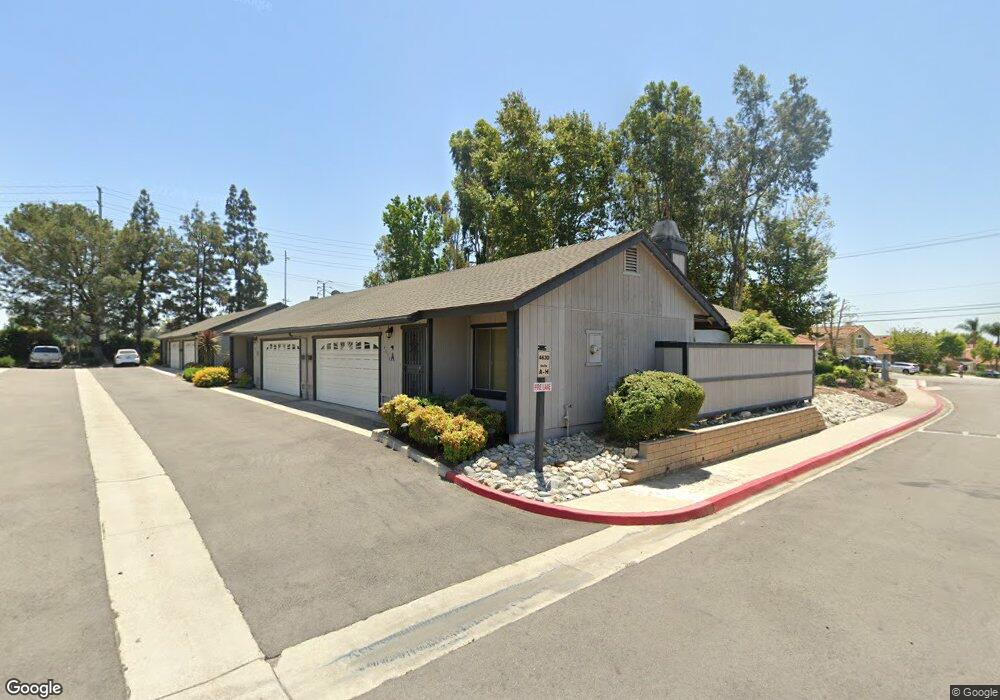
4630 San Jose St Montclair, CA 91763
Estimated Value: $508,000 - $632,000
3
Beds
2
Baths
1,490
Sq Ft
$376/Sq Ft
Est. Value
About This Home
This home is located at 4630 San Jose St, Montclair, CA 91763 and is currently estimated at $560,117, approximately $375 per square foot. 4630 San Jose St is a home located in San Bernardino County with nearby schools including Moreno Elementary, Serrano Middle School, and Montclair High School.
Ownership History
Date
Name
Owned For
Owner Type
Purchase Details
Closed on
Jul 21, 2006
Sold by
Dexter Winnie
Bought by
Franklin Investment Co
Current Estimated Value
Home Financials for this Owner
Home Financials are based on the most recent Mortgage that was taken out on this home.
Original Mortgage
$210,000
Outstanding Balance
$124,947
Interest Rate
6.69%
Mortgage Type
Seller Take Back
Estimated Equity
$435,170
Create a Home Valuation Report for This Property
The Home Valuation Report is an in-depth analysis detailing your home's value as well as a comparison with similar homes in the area
Home Values in the Area
Average Home Value in this Area
Purchase History
| Date | Buyer | Sale Price | Title Company |
|---|---|---|---|
| Franklin Investment Co | $340,000 | Ticor Title Company |
Source: Public Records
Mortgage History
| Date | Status | Borrower | Loan Amount |
|---|---|---|---|
| Open | Franklin Investment Co | $210,000 |
Source: Public Records
Tax History
| Year | Tax Paid | Tax Assessment Tax Assessment Total Assessment is a certain percentage of the fair market value that is determined by local assessors to be the total taxable value of land and additions on the property. | Land | Improvement |
|---|---|---|---|---|
| 2025 | $2,053 | $129,107 | $13,586 | $115,521 |
| 2024 | $1,404 | $126,576 | $13,320 | $113,256 |
| 2023 | $1,365 | $124,094 | $13,059 | $111,035 |
| 2022 | $1,347 | $121,661 | $12,803 | $108,858 |
| 2021 | $1,338 | $119,276 | $12,552 | $106,724 |
| 2020 | $1,315 | $118,053 | $12,423 | $105,630 |
| 2019 | $1,304 | $115,738 | $12,179 | $103,559 |
| 2018 | $1,286 | $113,468 | $11,940 | $101,528 |
| 2017 | $1,240 | $111,243 | $11,706 | $99,537 |
| 2016 | $1,192 | $109,061 | $11,476 | $97,585 |
| 2015 | $1,184 | $107,423 | $11,304 | $96,119 |
| 2014 | $1,147 | $105,319 | $11,083 | $94,236 |
Source: Public Records
Map
Nearby Homes
- 4424 San Jose St Unit 3
- 9382 Shadowood Dr
- 4465 Bonnie Brae St
- 9431 Shadowood Dr Unit E
- 9404 Round up Dr Unit B
- 646 Sycamore Ave Unit 18
- 436 Oakdale Dr
- 9587 Bolton Ave
- 416 Oakdale Dr
- 4863 Yale St
- 553 Wayland Ct
- 8951 Monte Vista Ave
- 517 Wayland Ct
- 4478 San Bernardino St
- 415 E Green St
- 9621 Mills Ave
- 536 S College Ave
- 539 S College Ave
- 118 Bryn Mawr Rd
- 2599 Huntington Dr
- 4630 San Jose St Unit C
- 4630 San Jose St Unit N
- 4630 San Jose St Unit Q
- 4630 San Jose St Unit D
- 4630 San Jose St Unit R
- 4630 San Jose St Unit A
- 4630 San Jose St Unit O
- 4630 San Jose St Unit S
- 4630 San Jose St Unit T
- 4630 San Jose St
- 4630 San Jose St
- 4630 San Jose St
- 4630 San Jose St
- 4630 San Jose St
- 4630 San Jose St
- 4630 San Jose St
- 4630 San Jose St
- 4630 San Jose St
- 4630 San Jose St
- 4630 San Jose St
Your Personal Tour Guide
Ask me questions while you tour the home.