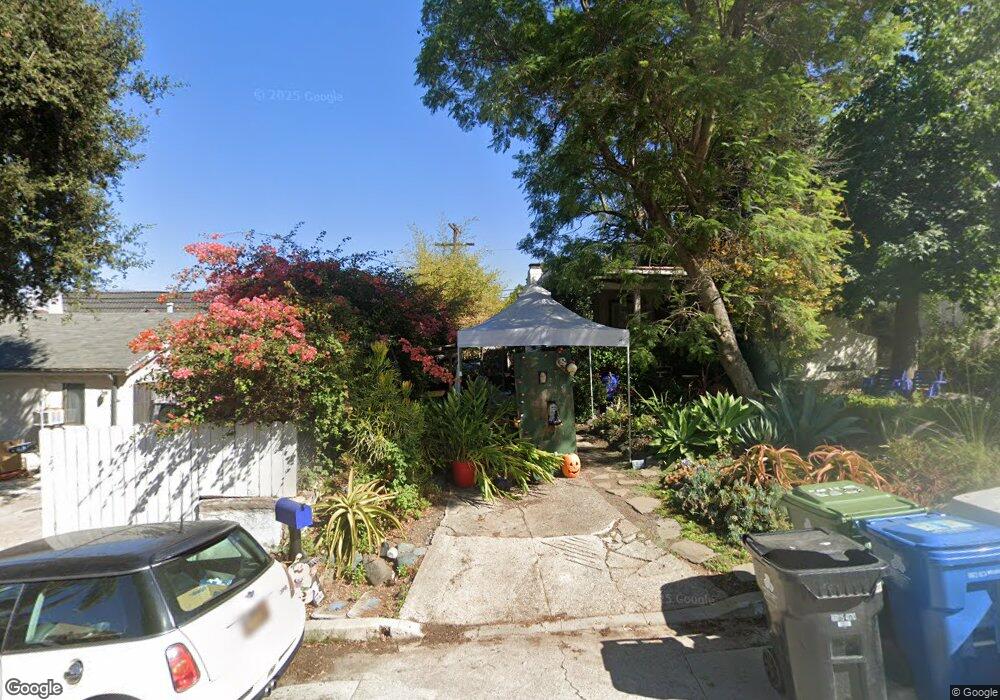
4656 Oak Grove Cir Los Angeles, CA 90041
Eagle Rock NeighborhoodEstimated Value: $927,000 - $1,139,000
2
Beds
1
Bath
956
Sq Ft
$1,088/Sq Ft
Est. Value
About This Home
This home is located at 4656 Oak Grove Cir, Los Angeles, CA 90041 and is currently estimated at $1,040,358, approximately $1,088 per square foot. 4656 Oak Grove Cir is a home located in Los Angeles County with nearby schools including Rockdale Elementary School, Eagle Rock High School, and PUC CALS Middle School and Early College High.
Ownership History
Date
Name
Owned For
Owner Type
Purchase Details
Closed on
Nov 15, 2001
Sold by
Dunn Rachel W
Bought by
Dunn Rachel W
Current Estimated Value
Home Financials for this Owner
Home Financials are based on the most recent Mortgage that was taken out on this home.
Original Mortgage
$160,000
Outstanding Balance
$62,121
Interest Rate
6.63%
Mortgage Type
Purchase Money Mortgage
Estimated Equity
$978,237
Purchase Details
Closed on
Jun 16, 2000
Sold by
Pajela Roel C
Bought by
Williams Rachel
Home Financials for this Owner
Home Financials are based on the most recent Mortgage that was taken out on this home.
Original Mortgage
$148,000
Interest Rate
8.2%
Purchase Details
Closed on
Jun 13, 1998
Sold by
Jarasa Silverio and Jarasa Melinda
Bought by
Pajela Roel C and Pajela Maria S
Home Financials for this Owner
Home Financials are based on the most recent Mortgage that was taken out on this home.
Original Mortgage
$105,800
Interest Rate
7.01%
Create a Home Valuation Report for This Property
The Home Valuation Report is an in-depth analysis detailing your home's value as well as a comparison with similar homes in the area
Home Values in the Area
Average Home Value in this Area
Purchase History
| Date | Buyer | Sale Price | Title Company |
|---|---|---|---|
| Dunn Rachel W | -- | Southland Title | |
| Dunn Rachel W | -- | Southland Title | |
| Williams Rachel | $186,818 | Chicago Title Co | |
| Pajela Roel C | -- | Chicago Title Co |
Source: Public Records
Mortgage History
| Date | Status | Borrower | Loan Amount |
|---|---|---|---|
| Open | Dunn Rachel W | $160,000 | |
| Closed | Dunn Rachel W | $160,000 | |
| Previous Owner | Williams Rachel | $148,000 | |
| Previous Owner | Pajela Roel C | $105,800 |
Source: Public Records
Tax History Compared to Growth
Tax History
| Year | Tax Paid | Tax Assessment Tax Assessment Total Assessment is a certain percentage of the fair market value that is determined by local assessors to be the total taxable value of land and additions on the property. | Land | Improvement |
|---|---|---|---|---|
| 2025 | $3,433 | $278,737 | $188,191 | $90,546 |
| 2024 | $3,433 | $273,272 | $184,501 | $88,771 |
| 2023 | $3,368 | $267,915 | $180,884 | $87,031 |
| 2022 | $3,213 | $262,663 | $177,338 | $85,325 |
| 2021 | $3,170 | $257,513 | $173,861 | $83,652 |
| 2019 | $3,075 | $249,877 | $168,705 | $81,172 |
| 2018 | $3,035 | $244,979 | $165,398 | $79,581 |
| 2016 | $2,893 | $235,468 | $158,976 | $76,492 |
| 2015 | $2,852 | $231,933 | $156,589 | $75,344 |
| 2014 | $2,868 | $227,391 | $153,522 | $73,869 |
Source: Public Records
Map
Nearby Homes
- 4631 4637 Loleta Place
- 1333 Wildwood Dr
- 1584 Oak Grove Place
- 1359 Wildwood Dr
- 1632 Oak Grove Dr
- 1938 Phillips Way
- 1942 Phillips Way
- 1902 N Avenue 51
- 1567 Fair Park Ave
- 1932 Phillips Way
- 1321 Wildwood Dr
- 5240 Barker Dr
- 1913 Nolden St
- 4890 Floristan Ave
- 4879 Hartwick St
- 1813 N Avenue 55
- 1813 N Avenue 53
- 4764 Wiota St
- 1800 N Avenue 55
- 4953 Mount Royal Dr
- 4652 Oak Grove Cir
- 1528 Oak Grove Dr
- 1522 Oak Grove Dr
- 4627 Loleta Ave
- 1516 Oak Grove Dr
- 1536 Oak Grove Dr
- 4651 Oak Grove Cir
- 4621 Loleta Ave
- 1512 Oak Grove Dr
- 4659 Oak Grove Cir
- 1542 Oak Grove Dr
- 1537 Wildwood Dr
- 1506 Oak Grove Dr
- 1533 Wildwood Dr
- 4651 Loleta Ave
- 1541 Wildwood Dr
- 4609 Loleta Ave
- 1527 Oak Grove Dr
- 1548 Oak Grove Dr
- 1531 Oak Grove Dr