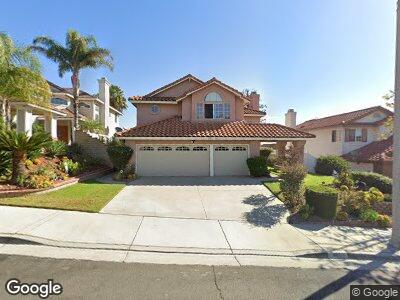
467 Bristol Way Corona, CA 92879
Corona Ranch NeighborhoodEstimated Value: $822,440 - $906,000
4
Beds
3
Baths
2,511
Sq Ft
$341/Sq Ft
Est. Value
About This Home
This home is located at 467 Bristol Way, Corona, CA 92879 and is currently estimated at $855,860, approximately $340 per square foot. 467 Bristol Way is a home located in Riverside County with nearby schools including Promenade Elementary School, Ysmael Villegas Middle School, and Hillcrest High School.
Ownership History
Date
Name
Owned For
Owner Type
Purchase Details
Closed on
Dec 10, 2020
Sold by
Garcia Rosa M and The Rosa M Garcia Living Trust
Bought by
Garcia Rosa M and The Rosa M Garcia Living Trust
Current Estimated Value
Home Financials for this Owner
Home Financials are based on the most recent Mortgage that was taken out on this home.
Original Mortgage
$887,250
Interest Rate
2.8%
Mortgage Type
Reverse Mortgage Home Equity Conversion Mortgage
Purchase Details
Closed on
Jan 12, 2017
Sold by
Garcia Rosa M
Bought by
Garcia Rosa M and The Rosa M Garcia Living Trust
Purchase Details
Closed on
Sep 9, 2003
Sold by
Garcia Rosa M
Bought by
Garcia Rosa M and Garcia Trust
Purchase Details
Closed on
Sep 25, 2002
Sold by
Berry William L and Berry Maria T
Bought by
Berry Maria T
Purchase Details
Closed on
Nov 2, 1995
Sold by
Carcia Alphonso
Bought by
Garcia Rosa M
Create a Home Valuation Report for This Property
The Home Valuation Report is an in-depth analysis detailing your home's value as well as a comparison with similar homes in the area
Home Values in the Area
Average Home Value in this Area
Purchase History
| Date | Buyer | Sale Price | Title Company |
|---|---|---|---|
| Garcia Rosa M | -- | Fidelity National Title Co | |
| Garcia Rosa M | -- | None Available | |
| Garcia Rosa M | -- | None Available | |
| Garcia Rosa M | -- | -- |
Source: Public Records
Mortgage History
| Date | Status | Borrower | Loan Amount |
|---|---|---|---|
| Closed | Rosa M Garcia Living Trust | $887,250 | |
| Closed | Garcia Rosa M | $887,250 | |
| Closed | Garcia Rosa M | $675,000 | |
| Closed | Garcia Rosa M | $150,000 | |
| Closed | Garcia Rosa M | $104,946 |
Source: Public Records
Tax History Compared to Growth
Tax History
| Year | Tax Paid | Tax Assessment Tax Assessment Total Assessment is a certain percentage of the fair market value that is determined by local assessors to be the total taxable value of land and additions on the property. | Land | Improvement |
|---|---|---|---|---|
| 2023 | $4,835 | $386,510 | $108,296 | $278,214 |
| 2022 | $4,460 | $378,932 | $106,173 | $272,759 |
| 2021 | $4,368 | $371,503 | $104,092 | $267,411 |
| 2020 | $4,297 | $367,695 | $103,025 | $264,670 |
| 2019 | $4,240 | $360,486 | $101,005 | $259,481 |
| 2018 | $4,179 | $353,419 | $99,025 | $254,394 |
| 2017 | $4,066 | $343,549 | $97,084 | $246,465 |
| 2016 | $3,998 | $336,814 | $95,181 | $241,633 |
| 2015 | $3,942 | $331,756 | $93,752 | $238,004 |
| 2014 | $3,930 | $325,259 | $91,916 | $233,343 |
Source: Public Records
Map
Nearby Homes
- 429 Somerset Cir
- 2901 Via Toscana Unit 101
- 2915 Via Milano Unit 202
- 2910 Via Toscana Unit 202
- 729 La Loma Ln
- 2951 Via Milano Unit 202
- 2599 Pinnacle Cir
- 778 La Cumbre St
- 3032 Astoria St
- 431 Surrey Cir
- 4224 Oliphant Ct
- 2420 Lenai Cir
- 835 Baghdady St
- 2677 Las Mercedes Cir
- 3751 Harvill Ln
- 2145 Highpointe Dr Unit 102
- 12929 Via Napoi
- 4311 Falconer Dr
- 2225 Indigo Hills Dr Unit 3
- 896 Baghdady St
- 467 Bristol Way
- 461 Bristol Way
- 475 Bristol Way
- 462 Somerset Cir
- 470 Somerset Cir
- 455 Bristol Way
- 479 Bristol Way
- 456 Somerset Cir
- 476 Somerset Cir
- 468 Bristol Way
- 462 Bristol Way
- 474 Bristol Way
- 450 Somerset Cir
- 483 Bristol Way
- 449 Bristol Way
- 480 Somerset Cir
- 456 Bristol Way
- 440 Somerset Cir
- 2770 Buckingham Way
- 491 Bristol Way