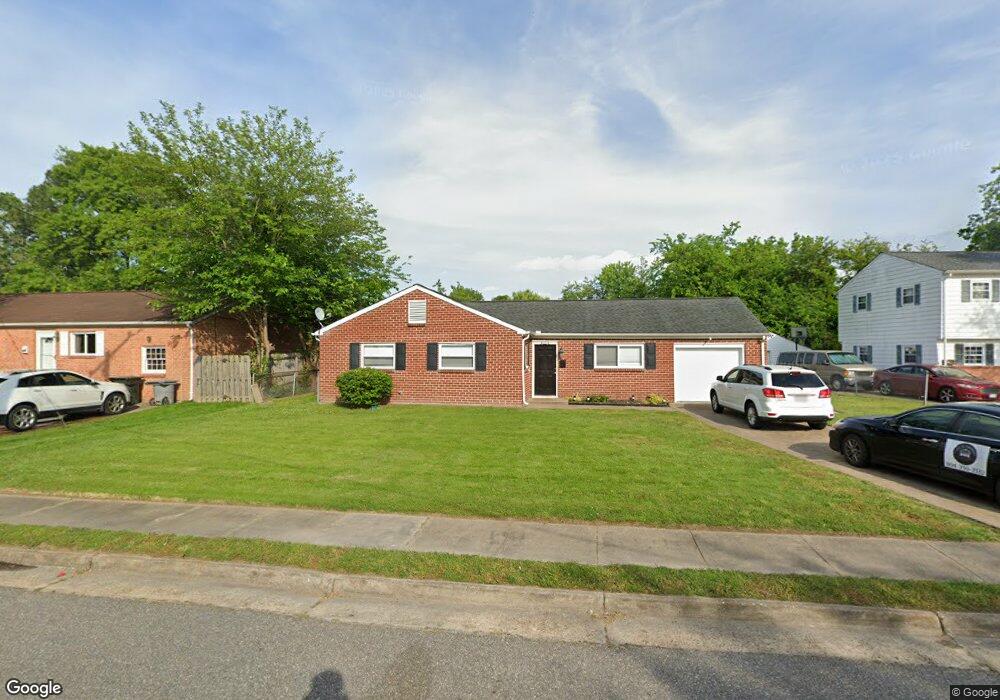
468 Duchess Ct Hampton, VA 23669
Fox Hill NeighborhoodEstimated Value: $299,000 - $324,000
5
Beds
3
Baths
1,578
Sq Ft
$197/Sq Ft
Est. Value
About This Home
This home is located at 468 Duchess Ct, Hampton, VA 23669 and is currently estimated at $310,409, approximately $196 per square foot. 468 Duchess Ct is a home located in Hampton City with nearby schools including Phillips Elementary School, Benjamin Syms Middle School, and Kecoughtan High School.
Ownership History
Date
Name
Owned For
Owner Type
Purchase Details
Closed on
Mar 15, 2020
Sold by
Bennett Deborah K and The David S Rosser Jr Trust
Bought by
Hudson Robbie
Current Estimated Value
Home Financials for this Owner
Home Financials are based on the most recent Mortgage that was taken out on this home.
Original Mortgage
$191,468
Outstanding Balance
$170,366
Interest Rate
3.75%
Mortgage Type
FHA
Estimated Equity
$140,043
Create a Home Valuation Report for This Property
The Home Valuation Report is an in-depth analysis detailing your home's value as well as a comparison with similar homes in the area
Home Values in the Area
Average Home Value in this Area
Purchase History
| Date | Buyer | Sale Price | Title Company |
|---|---|---|---|
| Hudson Robbie | $195,000 | Liberty Title & Escrow |
Source: Public Records
Mortgage History
| Date | Status | Borrower | Loan Amount |
|---|---|---|---|
| Open | Hudson Robbie | $191,468 |
Source: Public Records
Tax History
| Year | Tax Paid | Tax Assessment Tax Assessment Total Assessment is a certain percentage of the fair market value that is determined by local assessors to be the total taxable value of land and additions on the property. | Land | Improvement |
|---|---|---|---|---|
| 2025 | $3,440 | $296,800 | $60,000 | $236,800 |
| 2024 | $3,200 | $278,300 | $60,000 | $218,300 |
| 2023 | $3,057 | $263,500 | $60,000 | $203,500 |
| 2022 | $2,837 | $240,400 | $55,000 | $185,400 |
| 2021 | $2,800 | $199,200 | $50,000 | $149,200 |
| 2020 | $2,408 | $194,200 | $45,000 | $149,200 |
| 2019 | $1,986 | $160,200 | $45,000 | $115,200 |
| 2018 | $1,343 | $155,000 | $45,000 | $110,000 |
| 2017 | $2,016 | $0 | $0 | $0 |
| 2016 | $1,989 | $152,800 | $0 | $0 |
| 2015 | $999 | $0 | $0 | $0 |
| 2014 | $2,033 | $152,800 | $45,000 | $107,800 |
Source: Public Records
Map
Nearby Homes
- 709 Whitney Ct
- 702 Kings View Ct
- 639 Fairfield Blvd
- 116 Pine Creek Dr
- 702 Nottingham Dr
- 635 Kings View Ct
- 702 New Bern Ave
- 906 Allendale Dr
- 619 Queens View Ct
- 475 Fox Hill Rd
- 425 Sonora Dr
- 426 Stockton St
- 142 River Walk Ct
- 919 Laredo Ct
- 156 River Walk Ct
- 820 Lemaster Ave
- 10 Zilber Ct
- 8 Zilber Ct
- 22 Camellia Ln
- 353 Fox Hill Rd
Your Personal Tour Guide
Ask me questions while you tour the home.