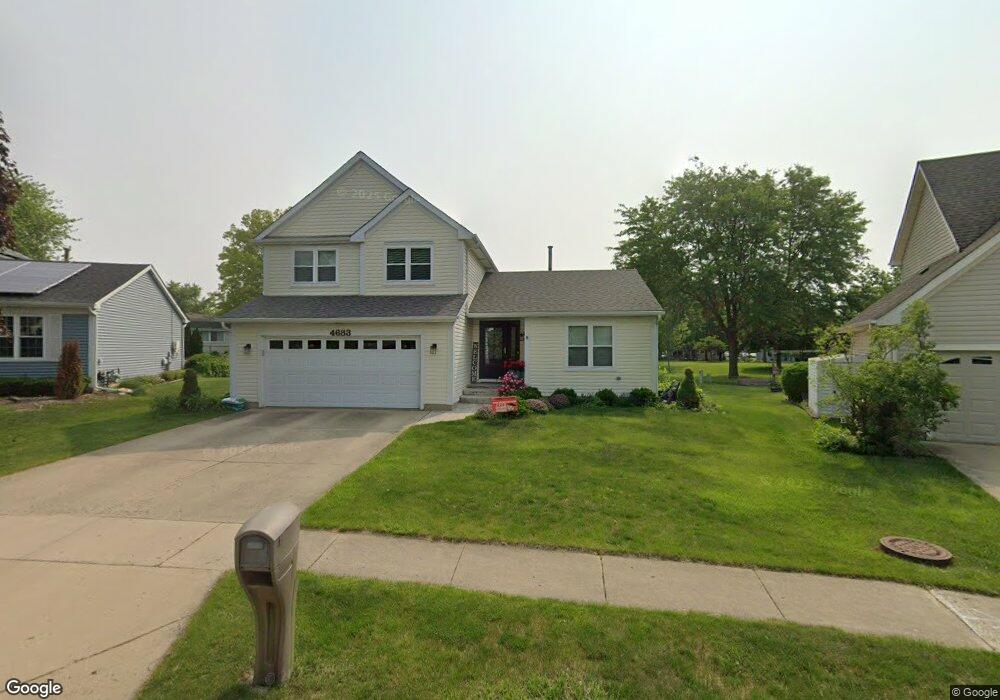
4683 Sunflower Ln Hoffman Estates, IL 60192
South Ridge NeighborhoodEstimated Value: $477,000 - $500,000
3
Beds
3
Baths
1,920
Sq Ft
$254/Sq Ft
Est. Value
About This Home
This home is located at 4683 Sunflower Ln, Hoffman Estates, IL 60192 and is currently estimated at $488,198, approximately $254 per square foot. 4683 Sunflower Ln is a home located in Cook County with nearby schools including Thomas Jefferson Elementary School, Frank C. Whiteley Elementary School, and Plum Grove Jr High School.
Ownership History
Date
Name
Owned For
Owner Type
Purchase Details
Closed on
Dec 23, 2019
Sold by
Desai Amish and Desai Komal
Bought by
Desai Amish U and Amish U Desai Declaration Trust
Current Estimated Value
Purchase Details
Closed on
Sep 17, 2007
Sold by
Meier James J and Meier Patricia L
Bought by
Desai Amish and Gajjar Komal
Home Financials for this Owner
Home Financials are based on the most recent Mortgage that was taken out on this home.
Original Mortgage
$188,000
Outstanding Balance
$119,394
Interest Rate
6.63%
Mortgage Type
Unknown
Estimated Equity
$368,804
Purchase Details
Closed on
Sep 4, 1996
Sold by
Koulourianos Laby and Koulourianos Chris
Bought by
Meier James J and Meier Patricia L
Home Financials for this Owner
Home Financials are based on the most recent Mortgage that was taken out on this home.
Original Mortgage
$86,000
Interest Rate
7.93%
Mortgage Type
Balloon
Create a Home Valuation Report for This Property
The Home Valuation Report is an in-depth analysis detailing your home's value as well as a comparison with similar homes in the area
Home Values in the Area
Average Home Value in this Area
Purchase History
| Date | Buyer | Sale Price | Title Company |
|---|---|---|---|
| Desai Amish U | -- | Attorney | |
| Desai Amish | $388,000 | Golden Title | |
| Meier James J | $206,000 | -- |
Source: Public Records
Mortgage History
| Date | Status | Borrower | Loan Amount |
|---|---|---|---|
| Open | Desai Amish | $188,000 | |
| Previous Owner | Meier James J | $86,000 |
Source: Public Records
Tax History Compared to Growth
Tax History
| Year | Tax Paid | Tax Assessment Tax Assessment Total Assessment is a certain percentage of the fair market value that is determined by local assessors to be the total taxable value of land and additions on the property. | Land | Improvement |
|---|---|---|---|---|
| 2024 | $10,020 | $34,488 | $6,041 | $28,447 |
| 2023 | $9,654 | $36,000 | $6,041 | $29,959 |
| 2022 | $9,654 | $36,000 | $6,041 | $29,959 |
| 2021 | $8,396 | $28,402 | $4,195 | $24,207 |
| 2020 | $8,286 | $28,402 | $4,195 | $24,207 |
| 2019 | $8,201 | $31,488 | $4,195 | $27,293 |
| 2018 | $7,285 | $26,430 | $3,859 | $22,571 |
| 2017 | $7,524 | $27,576 | $3,859 | $23,717 |
| 2016 | $7,237 | $27,576 | $3,859 | $23,717 |
| 2015 | $6,940 | $24,953 | $3,523 | $21,430 |
| 2014 | $7,424 | $26,914 | $3,523 | $23,391 |
| 2013 | $7,992 | $29,519 | $3,523 | $25,996 |
Source: Public Records
Map
Nearby Homes
- 1195 Old Timber Ct
- 1208 Old Timber Ln
- 4827 Turnberry Dr
- 1404 W Sapphire Dr
- 4944 Somerton Dr
- 4890 Prestwick Place
- 5070 Thornbark Dr
- 4658 Burnham Dr
- 5015 Rochester Dr
- 330 Poteet Ave
- 4760 Amber Cir
- 4320 Lombardy Ln
- 5190 Chambers Dr
- 70 Ela Rd
- 13 Chipping Campden Dr
- 85 Ela Rd
- 121 Florence Ave
- 404 Inverdale Dr
- 3960 Colony Ct
- 2022 Abbotsford Dr
- 4687 Sunflower Ln
- 4679 Sunflower Ln
- 1141 Woodhollow Ct
- 4691 Sunflower Ln
- 4675 Sunflower Ln
- 4680 Sunflower Ln
- 1131 Woodhollow Ct Unit 1
- 4701 Sunflower Ln
- 4690 Sunflower Ln
- 1142 Woodhollow Ct
- 1176 Sumac Trail
- 1121 Woodhollow Ct
- 4670 Sunflower Ln
- 1168 Sumac Trail
- 4700 Sunflower Ln
- 4711 Sunflower Ln
- 1111 Woodhollow Ct
- 1200 Sumac Trail
- 4710 Sunflower Ln
- 1140 Woodhollow Ct