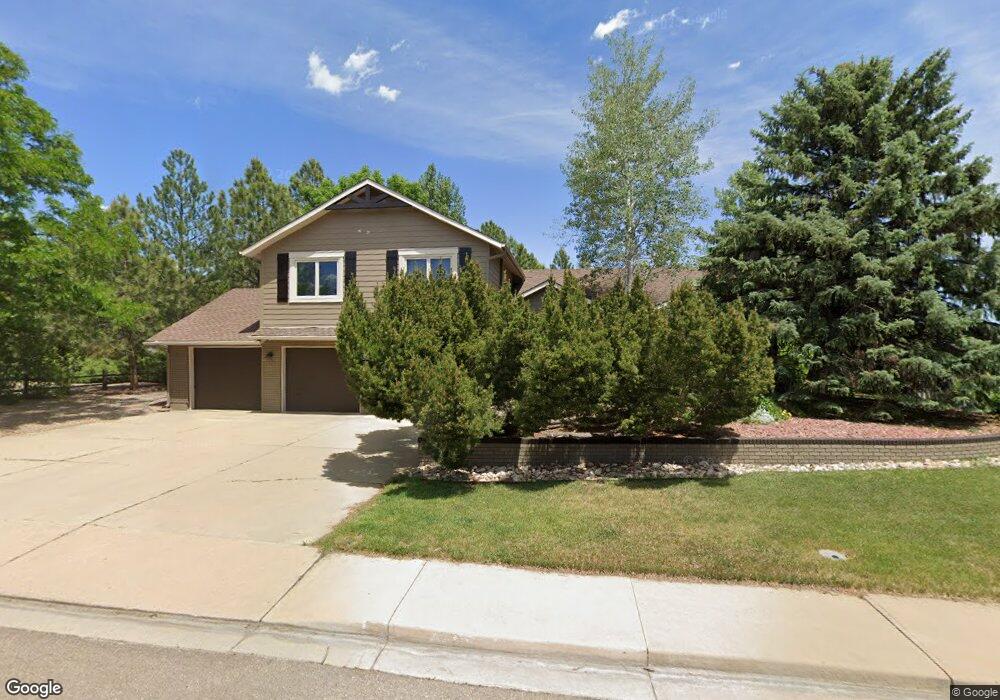
4699 Apple Way Boulder, CO 80301
Estimated Value: $1,203,751 - $1,559,000
4
Beds
3
Baths
2,184
Sq Ft
$628/Sq Ft
Est. Value
About This Home
This home is located at 4699 Apple Way, Boulder, CO 80301 and is currently estimated at $1,370,938, approximately $627 per square foot. 4699 Apple Way is a home located in Boulder County with nearby schools including Crest View Elementary School, Centennial Middle School, and Boulder High School.
Ownership History
Date
Name
Owned For
Owner Type
Purchase Details
Closed on
Oct 12, 2013
Sold by
Kelly Jimmie E and Kelly Kathleen C
Bought by
Kelly Jimmie E
Current Estimated Value
Home Financials for this Owner
Home Financials are based on the most recent Mortgage that was taken out on this home.
Original Mortgage
$938,250
Outstanding Balance
$644,184
Interest Rate
2.42%
Mortgage Type
Reverse Mortgage Home Equity Conversion Mortgage
Estimated Equity
$726,754
Purchase Details
Closed on
Feb 23, 1979
Bought by
Kelly Jimmie E
Purchase Details
Closed on
Mar 3, 1978
Bought by
Kelly Jimmie E
Create a Home Valuation Report for This Property
The Home Valuation Report is an in-depth analysis detailing your home's value as well as a comparison with similar homes in the area
Home Values in the Area
Average Home Value in this Area
Purchase History
| Date | Buyer | Sale Price | Title Company |
|---|---|---|---|
| Kelly Jimmie E | -- | Fitco | |
| Kelly Jimmie E | $106,000 | -- | |
| Kelly Jimmie E | $20,500 | -- |
Source: Public Records
Mortgage History
| Date | Status | Borrower | Loan Amount |
|---|---|---|---|
| Open | Kelly Jimmie E | $938,250 |
Source: Public Records
Tax History Compared to Growth
Tax History
| Year | Tax Paid | Tax Assessment Tax Assessment Total Assessment is a certain percentage of the fair market value that is determined by local assessors to be the total taxable value of land and additions on the property. | Land | Improvement |
|---|---|---|---|---|
| 2025 | $7,666 | $77,863 | $18,588 | $59,275 |
| 2024 | $7,666 | $77,863 | $18,588 | $59,275 |
| 2023 | $7,540 | $89,686 | $12,871 | $80,501 |
| 2022 | $5,538 | $63,725 | $10,356 | $53,369 |
| 2021 | $5,281 | $65,559 | $10,654 | $54,905 |
| 2020 | $4,548 | $56,871 | $19,019 | $37,852 |
| 2019 | $4,479 | $56,871 | $19,019 | $37,852 |
| 2018 | $4,007 | $51,163 | $16,632 | $34,531 |
| 2017 | $3,888 | $56,564 | $18,388 | $38,176 |
| 2016 | $3,633 | $47,832 | $17,910 | $29,922 |
| 2015 | $3,450 | $43,310 | $24,994 | $18,316 |
| 2014 | $4,016 | $43,310 | $24,994 | $18,316 |
Source: Public Records
Map
Nearby Homes
- 4190 Longview Ln
- 4557 Apple Way
- 4624 S Hampton Cir
- 3766 Ridgeway St
- 4258 Corriente Place Unit D3
- 3668 Pinedale St
- 3693 Silverton St
- 2770 Arbor Glen Place
- 3722 Monterey Place
- 4143 Sunrise Ct
- 3807 Paseo Del Prado St
- 3809 Paseo Del Prado St
- 2835 Links Dr
- 2954 Kalmia Ave Unit 34
- 5273 Independence Rd
- 2938 Kalmia Ave Unit 17
- 2736 Winding Trail Dr
- 5511 Pioneer Rd
- 2558 Premier Place
- 3673 Hazelwood Ct