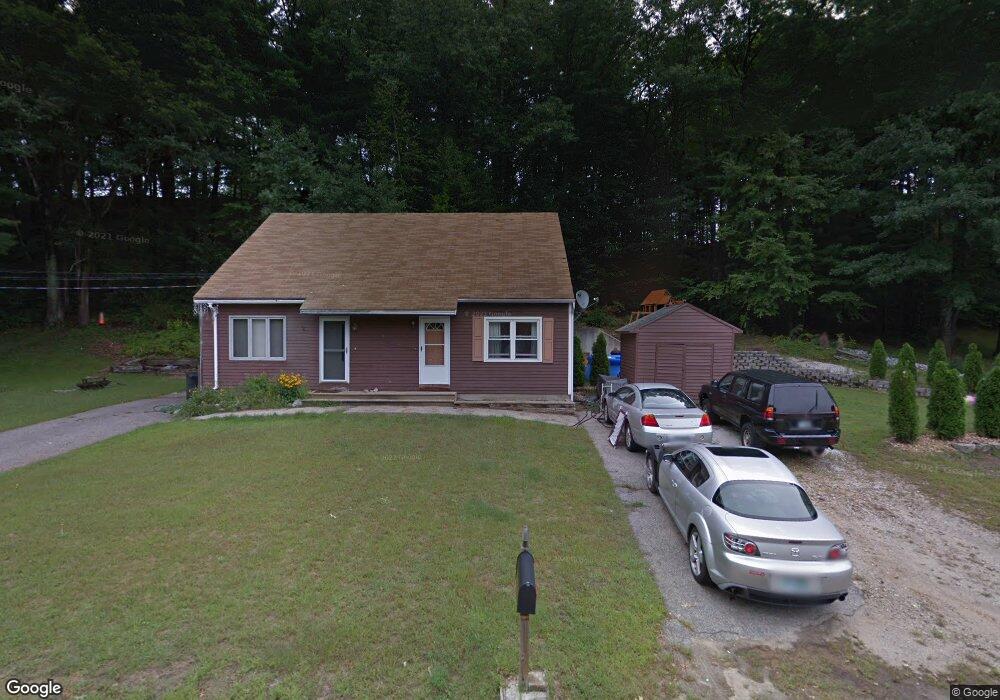
47 Dale Rd Unit B Hooksett, NH 03106
Estimated Value: $362,721 - $410,000
2
Beds
2
Baths
1,538
Sq Ft
$257/Sq Ft
Est. Value
About This Home
This home is located at 47 Dale Rd Unit B, Hooksett, NH 03106 and is currently estimated at $395,180, approximately $256 per square foot. 47 Dale Rd Unit B is a home located in Merrimack County with nearby schools including Fred C. Underhill School, Hooksett Memorial School, and David R. Cawley Middle School.
Ownership History
Date
Name
Owned For
Owner Type
Purchase Details
Closed on
Oct 30, 2024
Sold by
Tromp Andrea D
Bought by
Tromp Ret and Tromp
Current Estimated Value
Purchase Details
Closed on
Sep 25, 2017
Sold by
Hubbard Steven
Bought by
Moulin Frank C and Tromp Andrea D
Home Financials for this Owner
Home Financials are based on the most recent Mortgage that was taken out on this home.
Original Mortgage
$180,667
Interest Rate
3.9%
Mortgage Type
FHA
Purchase Details
Closed on
Oct 29, 2004
Sold by
Tuttle Richard A
Bought by
Hubbard Steven R
Home Financials for this Owner
Home Financials are based on the most recent Mortgage that was taken out on this home.
Original Mortgage
$123,080
Interest Rate
5.74%
Mortgage Type
Purchase Money Mortgage
Create a Home Valuation Report for This Property
The Home Valuation Report is an in-depth analysis detailing your home's value as well as a comparison with similar homes in the area
Home Values in the Area
Average Home Value in this Area
Purchase History
| Date | Buyer | Sale Price | Title Company |
|---|---|---|---|
| Tromp Ret | -- | None Available | |
| Moulin Frank C | $184,000 | -- | |
| Moulin Frank C | $184,000 | -- | |
| Hubbard Steven R | $155,100 | -- | |
| Hubbard Steven R | $155,100 | -- |
Source: Public Records
Mortgage History
| Date | Status | Borrower | Loan Amount |
|---|---|---|---|
| Previous Owner | Moulin Frank C | $180,667 | |
| Previous Owner | Hubbard Steven R | $128,800 | |
| Previous Owner | Hubbard Steven R | $123,080 |
Source: Public Records
Tax History Compared to Growth
Tax History
| Year | Tax Paid | Tax Assessment Tax Assessment Total Assessment is a certain percentage of the fair market value that is determined by local assessors to be the total taxable value of land and additions on the property. | Land | Improvement |
|---|---|---|---|---|
| 2024 | $5,193 | $306,200 | $70,000 | $236,200 |
| 2023 | $4,893 | $306,200 | $70,000 | $236,200 |
| 2022 | $4,348 | $180,800 | $46,800 | $134,000 |
| 2021 | $4,017 | $180,800 | $46,800 | $134,000 |
| 2020 | $4,070 | $180,800 | $46,800 | $134,000 |
| 2019 | $3,896 | $180,800 | $46,800 | $134,000 |
| 2018 | $3,999 | $180,800 | $46,800 | $134,000 |
| 2017 | $3,728 | $139,400 | $41,800 | $97,600 |
| 2016 | $3,679 | $139,400 | $41,800 | $97,600 |
| 2015 | $103 | $139,400 | $41,800 | $97,600 |
| 2014 | $3,461 | $139,400 | $41,800 | $97,600 |
| 2013 | $3,273 | $139,400 | $41,800 | $97,600 |
Source: Public Records
Map
Nearby Homes
- 2 Memory Ln
- 1601 Hooksett Rd
- 2 Wedgewood Cir Unit 14
- 1465 Hooksett Rd Unit 298
- 254 W River Rd
- 12 Crawford Ln
- 245 W River Rd
- 53 Cross Rd
- 65 Marlette Ave
- 121 Hackett Hill Rd
- 46 Moose Pond Terrace
- 14 Manor Dr Unit D
- 12 Manor Dr Unit B
- 5 Sunrise Blvd
- 1821 Hooksett Rd
- 62 Pine St
- 18 Julia Dr
- 34 Lindsay Rd
- 216 Hackett Hill Rd
- 261 Hackett Hill Rd
- 47 Dale Rd Unit A
- 47 Dale Rd
- 46 Dale Rd
- 46 Dale Rd Unit B
- 46 Dale Rd Unit A
- 46 Dale Rd Unit 46A
- 46a Dale Rd Unit A
- 45 Dale Rd Unit B
- 45 Dale Rd Unit A
- 48A Dale Rd
- 49 Dale Rd Unit B
- 49 Dale Rd Unit A
- 49 Dale Rd Unit 49B
- 49a Dale Rd
- 44 Dale Rd Unit B
- 44 Dale Rd Unit A
- 4 Memory Ln
- 43 Dale Rd Unit B
- 43 Dale Rd Unit A
- 43B Dale Rd