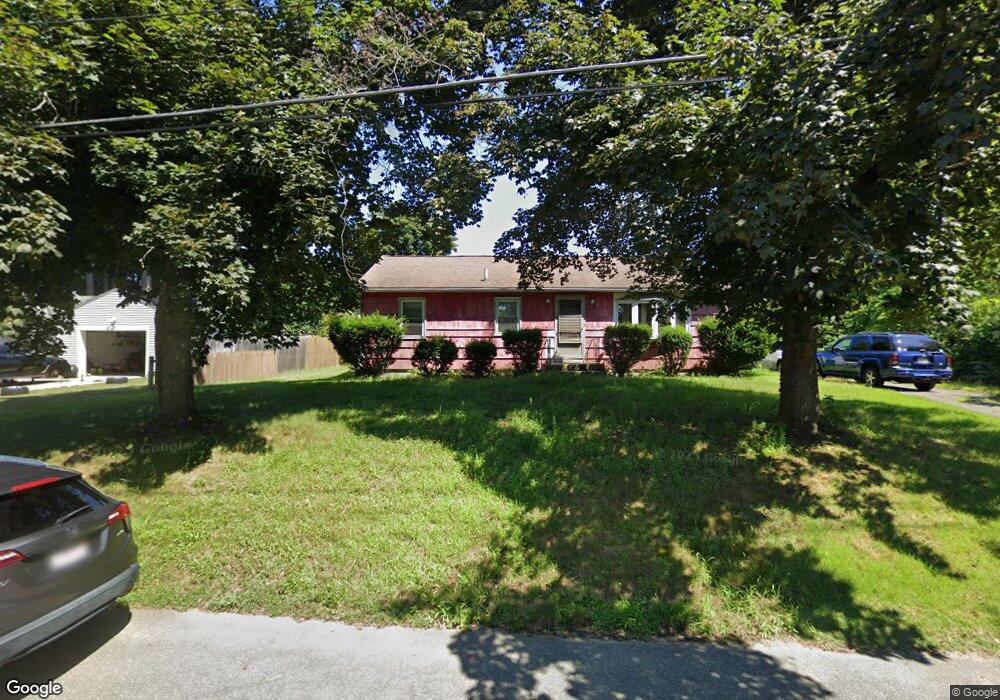
47 Flint St Springfield, MA 01129
Boston Road NeighborhoodEstimated Value: $272,000 - $313,000
3
Beds
2
Baths
1,040
Sq Ft
$277/Sq Ft
Est. Value
About This Home
This home is located at 47 Flint St, Springfield, MA 01129 and is currently estimated at $288,374, approximately $277 per square foot. 47 Flint St is a home located in Hampden County with nearby schools including Warner, M Marcus Kiley Middle, and Springfield Central High School.
Ownership History
Date
Name
Owned For
Owner Type
Purchase Details
Closed on
Oct 2, 2000
Sold by
Smith William G and Smith Carol A
Bought by
Oxley James and Oxley Theresa
Current Estimated Value
Home Financials for this Owner
Home Financials are based on the most recent Mortgage that was taken out on this home.
Original Mortgage
$83,333
Outstanding Balance
$30,434
Interest Rate
7.94%
Mortgage Type
Purchase Money Mortgage
Estimated Equity
$257,940
Create a Home Valuation Report for This Property
The Home Valuation Report is an in-depth analysis detailing your home's value as well as a comparison with similar homes in the area
Home Values in the Area
Average Home Value in this Area
Purchase History
| Date | Buyer | Sale Price | Title Company |
|---|---|---|---|
| Oxley James | $83,500 | -- |
Source: Public Records
Mortgage History
| Date | Status | Borrower | Loan Amount |
|---|---|---|---|
| Open | Oxley James | $83,333 |
Source: Public Records
Tax History
| Year | Tax Paid | Tax Assessment Tax Assessment Total Assessment is a certain percentage of the fair market value that is determined by local assessors to be the total taxable value of land and additions on the property. | Land | Improvement |
|---|---|---|---|---|
| 2025 | $3,398 | $216,700 | $58,400 | $158,300 |
| 2024 | $3,369 | $209,800 | $58,400 | $151,400 |
| 2023 | $3,345 | $196,200 | $55,600 | $140,600 |
| 2022 | $3,267 | $173,600 | $55,600 | $118,000 |
| 2021 | $3,032 | $160,400 | $50,600 | $109,800 |
| 2020 | $2,888 | $147,900 | $50,600 | $97,300 |
| 2019 | $2,637 | $134,000 | $50,600 | $83,400 |
| 2018 | $2,552 | $137,500 | $50,600 | $86,900 |
| 2017 | $2,552 | $129,800 | $45,600 | $84,200 |
| 2016 | $2,428 | $123,500 | $45,600 | $77,900 |
| 2015 | $2,345 | $119,200 | $45,600 | $73,600 |
Source: Public Records
Map
Nearby Homes
Your Personal Tour Guide
Ask me questions while you tour the home.