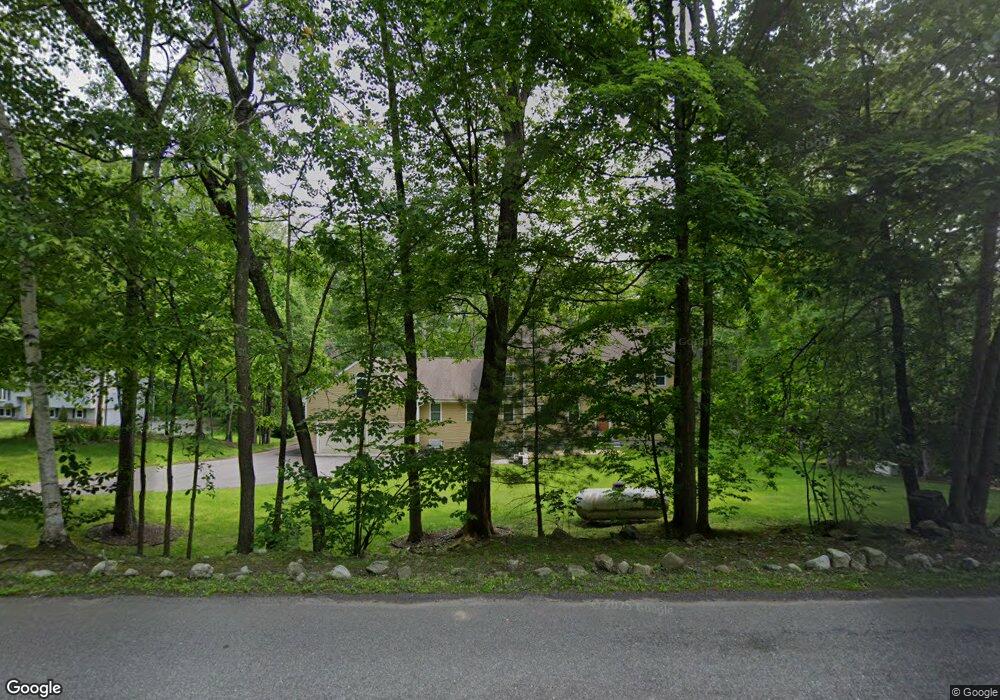
47 Goodhue Rd Windham, NH 03087
Estimated Value: $733,418 - $1,089,000
3
Beds
2
Baths
3,010
Sq Ft
$312/Sq Ft
Est. Value
About This Home
This home is located at 47 Goodhue Rd, Windham, NH 03087 and is currently estimated at $938,605, approximately $311 per square foot. 47 Goodhue Rd is a home located in Rockingham County with nearby schools including Golden Brook Elementary School, Windham Middle School, and Windham High School.
Ownership History
Date
Name
Owned For
Owner Type
Purchase Details
Closed on
Mar 22, 2013
Sold by
Pacheco Ronald and Pacheco Patricia D
Bought by
Pacheco Ft and Pacheco Ronald
Current Estimated Value
Home Financials for this Owner
Home Financials are based on the most recent Mortgage that was taken out on this home.
Original Mortgage
$300,000
Outstanding Balance
$211,990
Interest Rate
3.57%
Mortgage Type
Stand Alone Refi Refinance Of Original Loan
Estimated Equity
$726,616
Purchase Details
Closed on
Feb 14, 2013
Sold by
Oacheco Ft and Pacheco Ronald
Bought by
Pacheco Ronald and Pacheco Patricia D
Home Financials for this Owner
Home Financials are based on the most recent Mortgage that was taken out on this home.
Original Mortgage
$300,000
Outstanding Balance
$211,990
Interest Rate
3.57%
Mortgage Type
Stand Alone Refi Refinance Of Original Loan
Estimated Equity
$726,616
Purchase Details
Closed on
Dec 31, 1991
Bought by
Pacheco Ft
Create a Home Valuation Report for This Property
The Home Valuation Report is an in-depth analysis detailing your home's value as well as a comparison with similar homes in the area
Home Values in the Area
Average Home Value in this Area
Purchase History
| Date | Buyer | Sale Price | Title Company |
|---|---|---|---|
| Pacheco Ft | -- | -- | |
| Pacheco Ronald | -- | -- | |
| Pacheco Ft | -- | -- |
Source: Public Records
Mortgage History
| Date | Status | Borrower | Loan Amount |
|---|---|---|---|
| Open | Pacheco Ft | $300,000 |
Source: Public Records
Tax History Compared to Growth
Tax History
| Year | Tax Paid | Tax Assessment Tax Assessment Total Assessment is a certain percentage of the fair market value that is determined by local assessors to be the total taxable value of land and additions on the property. | Land | Improvement |
|---|---|---|---|---|
| 2024 | $12,065 | $532,900 | $188,400 | $344,500 |
| 2023 | $11,404 | $532,900 | $188,400 | $344,500 |
| 2022 | $10,477 | $530,200 | $188,400 | $341,800 |
| 2021 | $9,818 | $527,300 | $188,400 | $338,900 |
| 2020 | $10,087 | $527,300 | $188,400 | $338,900 |
| 2019 | $9,572 | $424,500 | $173,300 | $251,200 |
| 2018 | $9,644 | $414,100 | $173,300 | $240,800 |
| 2017 | $8,365 | $414,100 | $173,300 | $240,800 |
| 2016 | $9,036 | $414,100 | $173,300 | $240,800 |
| 2015 | $8,994 | $414,100 | $173,300 | $240,800 |
| 2014 | $8,705 | $362,700 | $178,000 | $184,700 |
| 2013 | $8,569 | $363,100 | $178,000 | $185,100 |
Source: Public Records
Map
Nearby Homes
- 242 Rockingham Rd
- 7 Evergreen Way
- 29 Hawk Dr
- 3 Evergreen Way
- 16 Autumn Woods Rd
- 2 Kinsman Ln
- 22 Jacob Rd
- 24 Rockingham Rd
- 41 Trails Edge Rd
- 44 Trails Edge Rd
- 69 Caddy Dr
- 84 Caddy Dr
- 26 Partridge Rd
- 35 Steele Rd
- 34 Shore Dr
- 26 King St
- 114 Chases Grove Rd
- 116 Chases Grove Rd
- 60 Shore Dr
- 120 Chases Grove Rd
- 45 Goodhue Rd
- 49 Goodhue Rd
- 46 Goodhue Rd
- 51 Goodhue Rd
- 44 Goodhue Rd
- 43 Goodhue Rd
- 53 Goodhue Rd
- 42 Goodhue Rd
- 48 Goodhue Rd
- 40 Goodhue Rd
- 2 Long Meadow Rd
- 10 Long Meadow Rd
- 4 Long Meadow Rd
- 12 Long Meadow Rd
- 6 Long Meadow Rd
- 1 Long Meadow Rd
- 38 Goodhue Rd
- 35 Goodhue Rd
- 62 Goodhue Rd
- 8 Longmeadow Rd