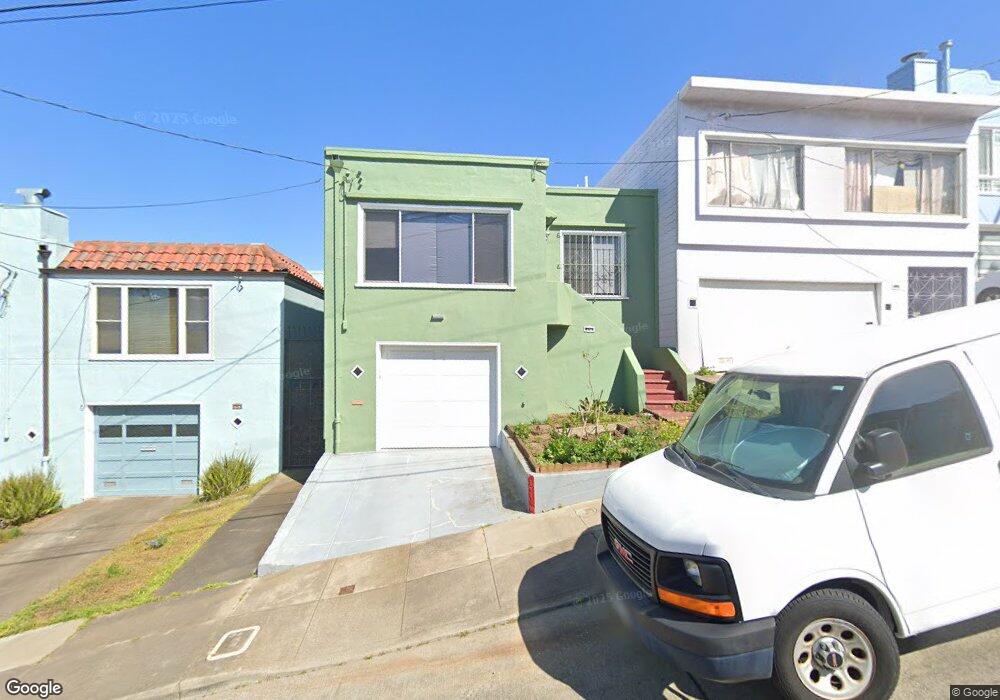
470 Arch St San Francisco, CA 94132
Merced Heights NeighborhoodEstimated Value: $778,000 - $1,138,000
2
Beds
1
Bath
1,000
Sq Ft
$981/Sq Ft
Est. Value
About This Home
This home is located at 470 Arch St, San Francisco, CA 94132 and is currently estimated at $981,437, approximately $981 per square foot. 470 Arch St is a home located in San Francisco County with nearby schools including Ortega (Jose) Elementary School, Aptos Middle School, and Stratford School.
Ownership History
Date
Name
Owned For
Owner Type
Purchase Details
Closed on
Dec 19, 2022
Sold by
Feng Rick
Bought by
Feng Rick and Kubota Alysa Feng
Current Estimated Value
Purchase Details
Closed on
May 26, 1994
Sold by
World S & L Assoc
Bought by
Feng Rick and Feng Lily
Home Financials for this Owner
Home Financials are based on the most recent Mortgage that was taken out on this home.
Original Mortgage
$109,900
Interest Rate
8.3%
Purchase Details
Closed on
Jan 19, 1994
Sold by
Golden West Svgs Assn Service Co
Bought by
World S&L Assn
Create a Home Valuation Report for This Property
The Home Valuation Report is an in-depth analysis detailing your home's value as well as a comparison with similar homes in the area
Home Values in the Area
Average Home Value in this Area
Purchase History
| Date | Buyer | Sale Price | Title Company |
|---|---|---|---|
| Feng Rick | -- | None Listed On Document | |
| Feng Rick | $157,000 | Fidelity National Title Co | |
| World S&L Assn | $182,868 | Fidelity National Title Co |
Source: Public Records
Mortgage History
| Date | Status | Borrower | Loan Amount |
|---|---|---|---|
| Previous Owner | Feng Rick | $109,900 |
Source: Public Records
Tax History Compared to Growth
Tax History
| Year | Tax Paid | Tax Assessment Tax Assessment Total Assessment is a certain percentage of the fair market value that is determined by local assessors to be the total taxable value of land and additions on the property. | Land | Improvement |
|---|---|---|---|---|
| 2025 | $3,175 | $266,770 | $152,934 | $113,836 |
| 2024 | $3,175 | $261,540 | $149,936 | $111,604 |
| 2023 | $3,131 | $256,414 | $146,998 | $109,416 |
| 2022 | $3,077 | $251,425 | $144,133 | $107,292 |
| 2021 | $3,026 | $246,496 | $141,307 | $105,189 |
| 2020 | $3,714 | $243,970 | $139,859 | $104,111 |
| 2019 | $3,593 | $239,187 | $137,117 | $102,070 |
| 2018 | $3,471 | $234,498 | $134,429 | $100,069 |
| 2017 | $3,132 | $229,901 | $131,794 | $98,107 |
| 2016 | $3,050 | $225,394 | $129,210 | $96,184 |
| 2015 | $3,008 | $222,010 | $127,270 | $94,740 |
| 2014 | $2,930 | $217,662 | $124,777 | $92,885 |
Source: Public Records
Map
Nearby Homes