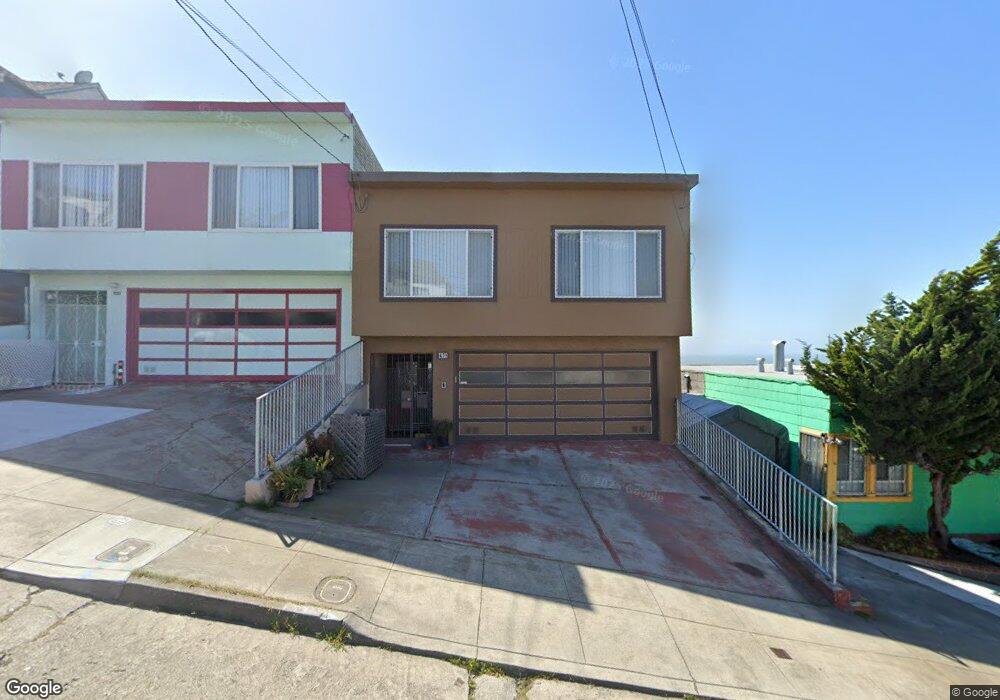
471 Bright St San Francisco, CA 94132
Merced Heights NeighborhoodEstimated Value: $1,059,376 - $1,392,000
3
Beds
2
Baths
1,461
Sq Ft
$826/Sq Ft
Est. Value
About This Home
This home is located at 471 Bright St, San Francisco, CA 94132 and is currently estimated at $1,206,594, approximately $825 per square foot. 471 Bright St is a home located in San Francisco County with nearby schools including Ortega (Jose) Elementary School, Aptos Middle School, and Leadership High School.
Ownership History
Date
Name
Owned For
Owner Type
Purchase Details
Closed on
Mar 12, 2013
Sold by
Ma Cui Bi and Ma Shi Yang
Bought by
Ma Cui Bi and Ma Shi Yang
Current Estimated Value
Home Financials for this Owner
Home Financials are based on the most recent Mortgage that was taken out on this home.
Original Mortgage
$215,800
Interest Rate
3.53%
Mortgage Type
New Conventional
Purchase Details
Closed on
Mar 6, 2013
Sold by
Tom Phillip
Bought by
Ma Cui Bi
Home Financials for this Owner
Home Financials are based on the most recent Mortgage that was taken out on this home.
Original Mortgage
$215,800
Interest Rate
3.53%
Mortgage Type
New Conventional
Purchase Details
Closed on
Jul 27, 2010
Sold by
Ma Shi Yang and Ma Cui Bi
Bought by
Ma Shi Yang and Ma Cui Bi
Create a Home Valuation Report for This Property
The Home Valuation Report is an in-depth analysis detailing your home's value as well as a comparison with similar homes in the area
Home Values in the Area
Average Home Value in this Area
Purchase History
| Date | Buyer | Sale Price | Title Company |
|---|---|---|---|
| Ma Cui Bi | -- | Fidelity National Title Co | |
| Ma Cui Bi | -- | Fidelity National Title Co | |
| Ma Shi Yang | -- | None Available |
Source: Public Records
Mortgage History
| Date | Status | Borrower | Loan Amount |
|---|---|---|---|
| Closed | Ma Cui Bi | $215,800 |
Source: Public Records
Tax History Compared to Growth
Tax History
| Year | Tax Paid | Tax Assessment Tax Assessment Total Assessment is a certain percentage of the fair market value that is determined by local assessors to be the total taxable value of land and additions on the property. | Land | Improvement |
|---|---|---|---|---|
| 2025 | $6,407 | $489,152 | $277,014 | $212,138 |
| 2024 | $6,407 | $479,566 | $271,584 | $207,982 |
| 2023 | $6,303 | $470,166 | $266,260 | $203,906 |
| 2022 | $6,171 | $460,950 | $261,040 | $199,910 |
| 2021 | $6,058 | $451,916 | $255,924 | $195,992 |
| 2020 | $6,151 | $447,286 | $253,302 | $193,984 |
| 2019 | $5,945 | $438,520 | $248,338 | $190,182 |
| 2018 | $5,742 | $429,828 | $243,412 | $186,416 |
| 2017 | $5,377 | $421,402 | $238,640 | $182,762 |
| 2016 | $5,264 | $413,142 | $233,962 | $179,180 |
| 2015 | $5,195 | $406,940 | $230,450 | $176,490 |
| 2014 | $5,059 | $398,974 | $225,938 | $173,036 |
Source: Public Records
Map
Nearby Homes