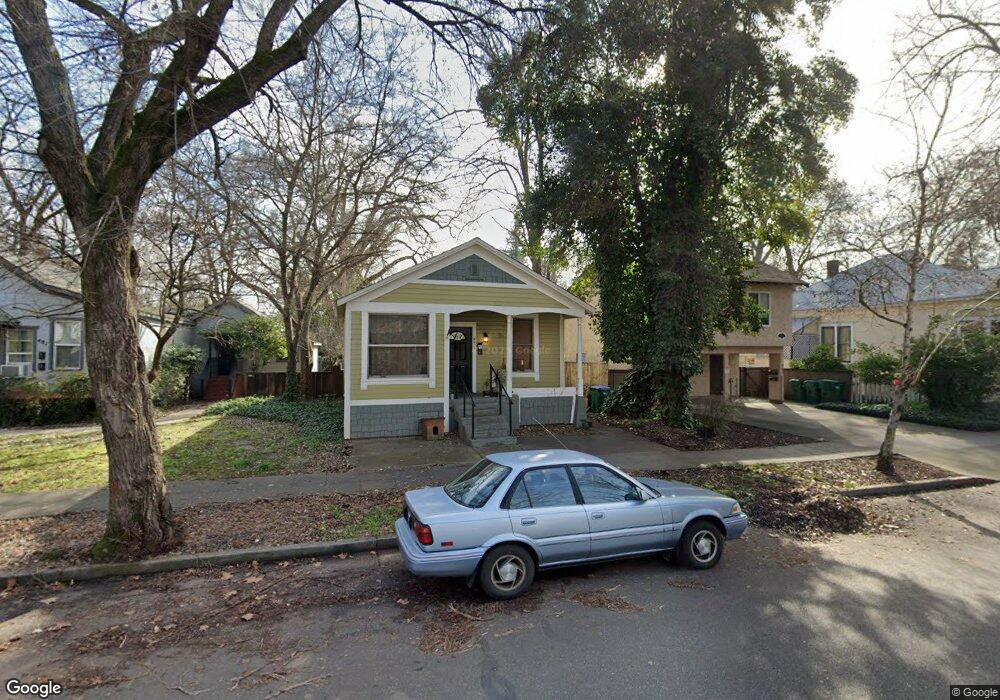
471 E 3rd St Chico, CA 95928
East Streets NeighborhoodEstimated Value: $291,930 - $347,000
2
Beds
2
Baths
1,057
Sq Ft
$307/Sq Ft
Est. Value
About This Home
This home is located at 471 E 3rd St, Chico, CA 95928 and is currently estimated at $323,983, approximately $306 per square foot. 471 E 3rd St is a home located in Butte County with nearby schools including Parkview Elementary School, Chico Junior High School, and Chico High School.
Ownership History
Date
Name
Owned For
Owner Type
Purchase Details
Closed on
Sep 4, 2015
Sold by
Ginno Bryan
Bought by
South Chico Chicas Llc
Current Estimated Value
Purchase Details
Closed on
Feb 18, 2009
Sold by
Ginno Lindsay
Bought by
Ginno Bryan
Purchase Details
Closed on
Mar 12, 2001
Sold by
Ginno Robert A
Bought by
Ginno Kerry L
Purchase Details
Closed on
Apr 16, 1997
Sold by
Dean Belva Hill and Dean Presley L
Bought by
Ginno Robert A and Ginno Kerry L
Home Financials for this Owner
Home Financials are based on the most recent Mortgage that was taken out on this home.
Original Mortgage
$68,000
Interest Rate
7.96%
Create a Home Valuation Report for This Property
The Home Valuation Report is an in-depth analysis detailing your home's value as well as a comparison with similar homes in the area
Home Values in the Area
Average Home Value in this Area
Purchase History
| Date | Buyer | Sale Price | Title Company |
|---|---|---|---|
| South Chico Chicas Llc | $205,000 | Mid Valley Title & Escrow Co | |
| Ginno Bryan | $105,500 | None Available | |
| Ginno Kerry L | -- | Mid Valley Title | |
| Ginno Robert A | $87,500 | Mid Valley Title & Escrow Co |
Source: Public Records
Mortgage History
| Date | Status | Borrower | Loan Amount |
|---|---|---|---|
| Previous Owner | Ginno Robert A | $68,000 |
Source: Public Records
Tax History
| Year | Tax Paid | Tax Assessment Tax Assessment Total Assessment is a certain percentage of the fair market value that is determined by local assessors to be the total taxable value of land and additions on the property. | Land | Improvement |
|---|---|---|---|---|
| 2025 | $2,636 | $242,671 | $177,566 | $65,105 |
| 2024 | $2,636 | $237,914 | $174,085 | $63,829 |
| 2023 | $2,605 | $233,250 | $170,672 | $62,578 |
| 2022 | $2,563 | $228,677 | $167,326 | $61,351 |
| 2021 | $2,515 | $224,195 | $164,046 | $60,149 |
| 2020 | $2,508 | $221,897 | $162,364 | $59,533 |
| 2019 | $2,463 | $217,547 | $159,181 | $58,366 |
| 2018 | $2,418 | $213,282 | $156,060 | $57,222 |
| 2017 | $2,368 | $209,100 | $153,000 | $56,100 |
| 2016 | $2,162 | $205,000 | $150,000 | $55,000 |
| 2015 | $1,909 | $178,193 | $91,289 | $86,904 |
| 2014 | $1,863 | $174,703 | $89,501 | $85,202 |
Source: Public Records
Map
Nearby Homes
- 686 E 7th St
- 555 Vallombrosa Ave Unit 14
- 555 Vallombrosa Ave Unit 25
- 0 California 32
- 667 E 8th St
- 271 E 8th St
- 827 Arbutus Ave
- 541 W 5th St
- 1001 Salem St
- 1029 Salem St
- 363 E 1st Ave
- 1224 Locust St
- 1022 Linden St
- 557 E 1st Ave
- 1050 Esplanade
- 1169 E 9th St
- 256 E 1st Ave
- 168 E 1st Ave
- 225 W 12th St
- 1202 Palm Ave
Your Personal Tour Guide
Ask me questions while you tour the home.