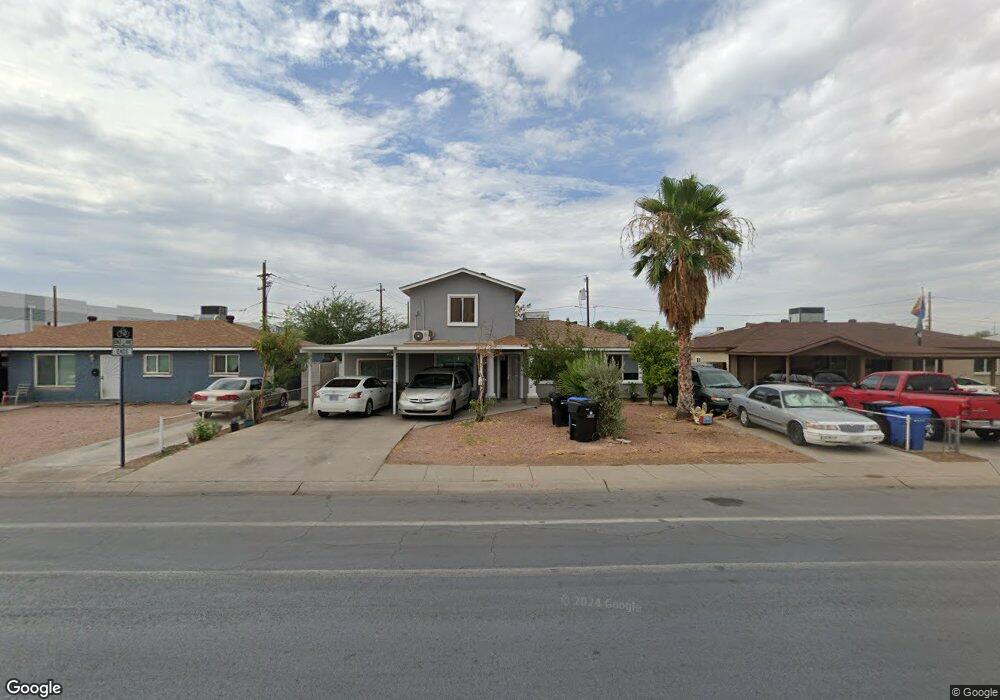
4711 W Campbell Ave Phoenix, AZ 85031
Maryvale NeighborhoodEstimated Value: $335,000 - $410,000
5
Beds
3
Baths
2,037
Sq Ft
$178/Sq Ft
Est. Value
About This Home
This home is located at 4711 W Campbell Ave, Phoenix, AZ 85031 and is currently estimated at $363,570, approximately $178 per square foot. 4711 W Campbell Ave is a home located in Maricopa County with nearby schools including James W. Rice Primary School, Alhambra High School, and Phoenix Coding Academy.
Ownership History
Date
Name
Owned For
Owner Type
Purchase Details
Closed on
Sep 27, 2024
Sold by
Alvarado Jose A and Alvarado Jasmin K
Bought by
Alvarado Miriam M and Alvarado Ivee J
Current Estimated Value
Purchase Details
Closed on
Apr 19, 2013
Sold by
Garcia Maria D
Bought by
Alvarado Jose A and Alvarado Miriam M
Purchase Details
Closed on
Dec 3, 2008
Sold by
Citimortgage Inc
Bought by
Garcia Maria
Purchase Details
Closed on
May 29, 2008
Sold by
Valenzuela Salomon
Bought by
Citimortgage Inc
Purchase Details
Closed on
Jul 2, 2007
Sold by
Valenzuela Salomon
Bought by
Pena Berta Onilda
Purchase Details
Closed on
Apr 11, 2006
Sold by
Gibbons Dorothy C
Bought by
Valenzuela Salomon
Home Financials for this Owner
Home Financials are based on the most recent Mortgage that was taken out on this home.
Original Mortgage
$200,000
Interest Rate
8.85%
Mortgage Type
Purchase Money Mortgage
Create a Home Valuation Report for This Property
The Home Valuation Report is an in-depth analysis detailing your home's value as well as a comparison with similar homes in the area
Home Values in the Area
Average Home Value in this Area
Purchase History
| Date | Buyer | Sale Price | Title Company |
|---|---|---|---|
| Alvarado Miriam M | -- | None Listed On Document | |
| Alvarado Jose A | $40,000 | None Available | |
| Garcia Maria | $31,500 | Lps Title Agency Inc | |
| Citimortgage Inc | $88,592 | First American Title | |
| Citimortgage Inc | $88,592 | First American Title | |
| Pena Berta Onilda | -- | None Available | |
| Valenzuela Salomon | $200,000 | Commonwealth Land Title Insu |
Source: Public Records
Mortgage History
| Date | Status | Borrower | Loan Amount |
|---|---|---|---|
| Previous Owner | Valenzuela Salomon | $200,000 |
Source: Public Records
Tax History
| Year | Tax Paid | Tax Assessment Tax Assessment Total Assessment is a certain percentage of the fair market value that is determined by local assessors to be the total taxable value of land and additions on the property. | Land | Improvement |
|---|---|---|---|---|
| 2025 | $1,056 | $6,679 | -- | -- |
| 2024 | $964 | $6,361 | -- | -- |
| 2023 | $964 | $24,450 | $4,890 | $19,560 |
| 2022 | $949 | $19,850 | $3,970 | $15,880 |
| 2021 | $958 | $16,760 | $3,350 | $13,410 |
| 2020 | $921 | $15,420 | $3,080 | $12,340 |
| 2019 | $910 | $13,170 | $2,630 | $10,540 |
| 2018 | $840 | $12,410 | $2,480 | $9,930 |
| 2017 | $829 | $9,860 | $1,970 | $7,890 |
| 2016 | $794 | $8,810 | $1,760 | $7,050 |
| 2015 | $752 | $7,350 | $1,470 | $5,880 |
Source: Public Records
Map
Nearby Homes
- 4345 N 47th Dr
- 4602 N 47th Ave
- 4915 W Montecito Ave
- 4848 W Highland Ave
- 4720 W Monterosa St
- 4724 W Monterosa St
- 4411 N 50th Dr
- 4133 N 49th Ave
- 4218 N 49th Dr
- 4936 W Highland Ave
- 4507 N 51st Ave
- 4129 N 49th Dr
- 4107 N 49th Dr
- 4016 N 47th Ln
- 4727 N 50th Dr
- 4108 N 49th Dr
- 4021 N 49th Ave
- 4715 N 51st Ave
- 4536 W Indianola Ave Unit 1
- 4610 W Indianola Ave
- 4707 W Campbell Ave Unit 2A
- 4717 W Campbell Ave
- 4721 W Campbell Ave
- 4718 W Roma Ave
- 4701 W Campbell Ave
- 4716 W Roma Ave
- 4436 N 47th Ave
- 4722 W Roma Ave
- 4727 W Campbell Ave
- 4430 N 47th Ave
- 4728 W Roma Ave
- 4731 W Campbell Ave
- 4715 W Roma Ave
- 4426 N 47th Ave
- 4732 W Roma Ave
- 4717 W Roma Ave
- 4721 W Roma Ave
- 4422 N 47th Ave
- 4727 W Roma Ave Unit 2A
- 4731 W Roma Ave
Your Personal Tour Guide
Ask me questions while you tour the home.