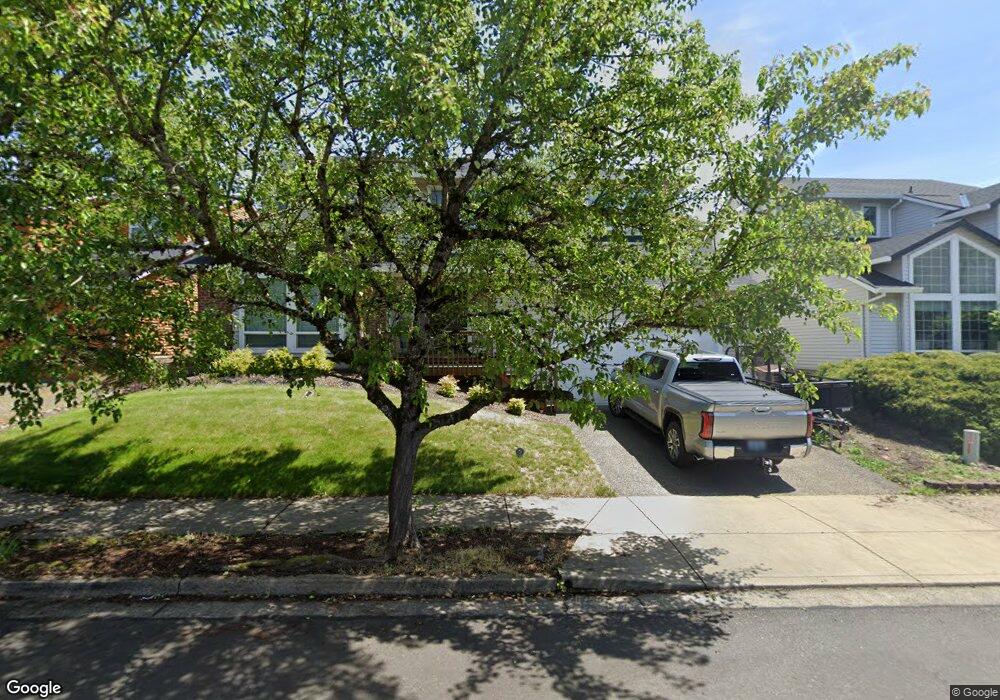
472 NW Battaglia Ave Gresham, OR 97030
Northwest Gresham NeighborhoodEstimated Value: $485,000 - $574,000
3
Beds
3
Baths
2,500
Sq Ft
$215/Sq Ft
Est. Value
About This Home
This home is located at 472 NW Battaglia Ave, Gresham, OR 97030 and is currently estimated at $537,303, approximately $214 per square foot. 472 NW Battaglia Ave is a home located in Multnomah County with nearby schools including North Gresham Elementary School, Clear Creek Middle School, and Gresham High School.
Ownership History
Date
Name
Owned For
Owner Type
Purchase Details
Closed on
Oct 15, 2009
Sold by
Oneill Sharmon
Bought by
Gogolev Vitaliy and Gogolev Olga I
Current Estimated Value
Home Financials for this Owner
Home Financials are based on the most recent Mortgage that was taken out on this home.
Original Mortgage
$256,272
Outstanding Balance
$166,405
Interest Rate
5.05%
Mortgage Type
FHA
Estimated Equity
$370,898
Purchase Details
Closed on
May 12, 2005
Sold by
Flerchinger Gregory E
Bought by
Oneill Daniel and Oneill Sharmon A
Home Financials for this Owner
Home Financials are based on the most recent Mortgage that was taken out on this home.
Original Mortgage
$224,000
Interest Rate
5.84%
Mortgage Type
Fannie Mae Freddie Mac
Purchase Details
Closed on
Apr 18, 2001
Sold by
Beacon Homes Inc
Bought by
Flerchinger Amy R and Flerchinger Gregory E
Home Financials for this Owner
Home Financials are based on the most recent Mortgage that was taken out on this home.
Original Mortgage
$164,000
Interest Rate
6.98%
Mortgage Type
Purchase Money Mortgage
Create a Home Valuation Report for This Property
The Home Valuation Report is an in-depth analysis detailing your home's value as well as a comparison with similar homes in the area
Home Values in the Area
Average Home Value in this Area
Purchase History
| Date | Buyer | Sale Price | Title Company |
|---|---|---|---|
| Gogolev Vitaliy | $261,000 | Chicago Title Ins Co Of Or | |
| Oneill Daniel | $280,000 | Fidelity Natl Title Co Of Or | |
| Flerchinger Amy R | $205,000 | Fidelity National Title Co |
Source: Public Records
Mortgage History
| Date | Status | Borrower | Loan Amount |
|---|---|---|---|
| Open | Gogolev Vitaliy | $256,272 | |
| Previous Owner | Oneill Daniel | $224,000 | |
| Previous Owner | Flerchinger Amy R | $164,000 | |
| Closed | Oneill Daniel | $28,000 |
Source: Public Records
Tax History Compared to Growth
Tax History
| Year | Tax Paid | Tax Assessment Tax Assessment Total Assessment is a certain percentage of the fair market value that is determined by local assessors to be the total taxable value of land and additions on the property. | Land | Improvement |
|---|---|---|---|---|
| 2025 | $6,911 | $339,620 | -- | -- |
| 2024 | $6,616 | $329,730 | -- | -- |
| 2023 | $6,027 | $320,130 | $0 | $0 |
| 2022 | $5,859 | $310,810 | $0 | $0 |
| 2021 | $5,711 | $301,760 | $0 | $0 |
| 2020 | $5,374 | $292,980 | $0 | $0 |
| 2019 | $5,233 | $284,450 | $0 | $0 |
| 2018 | $4,990 | $276,170 | $0 | $0 |
| 2017 | $4,787 | $268,130 | $0 | $0 |
| 2016 | $4,221 | $260,330 | $0 | $0 |
| 2015 | $4,091 | $252,750 | $0 | $0 |
| 2014 | $3,961 | $245,390 | $0 | $0 |
Source: Public Records
Map
Nearby Homes
- 2514 NW 3rd Terrace
- 249 NW Battaglia Ave
- 2528 NW 2nd Terrace
- 2590 NW 2nd Terrace
- 2591 NW 1st Dr
- 0 NW Mawrcrest Dr Unit 35-36 354362673
- 0 NW Mawrcrest Dr Unit 31-34
- 0 NW Mawrcrest Dr Unit 8-11 152456654
- 0 NW Mawrcrest Dr Unit 27-30 621615619
- 815 NW Battaglia Ave
- 855 NW Mawrcrest Dr
- 85 SW Mawrcrest Ave
- 181 SW Mawrcrest Ave
- 185 SW Mawrcrest Ave
- 3412 NW 1st St
- 1387 NW Riverview Ave Unit 14B
- 421 SW Lillyben Ave
- 2629 SE 190th Ave
- 2549 SE 190th Ave
- 2442 SE 190th Ave
- 484 NW Battaglia Ave
- 458 NW Battaglia Ave
- 423 NW Bryn Mawr Place
- 461 NW Bryn Mawr Place
- 423 NW Bryn Mawr Relisted
- 2575 NW 4th St
- 496 NW Battaglia Ave
- 481 NW Battaglia Ave
- 416 NW Battaglia Ave
- 497 NW Battaglia Ave
- 465 NW Battaglia Ave
- 407 NW Bryn Mawr Place
- 489 NW Bryn Mawr Place
- 449 NW Battaglia Ave
- 417 NW Battaglia Ave
- 493 NW Bryn Mawr Place
- 424 NW Bryn Mawr Place
- 525 NW Battaglia Ave
- 530 NW Battaglia Ave
- 403 NW Battaglia Ave