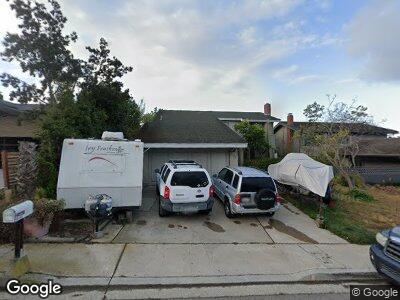
4722 Murat Place San Diego, CA 92117
Bay Ho NeighborhoodEstimated Value: $1,329,000 - $1,841,845
5
Beds
3
Baths
2,259
Sq Ft
$714/Sq Ft
Est. Value
About This Home
This home is located at 4722 Murat Place, San Diego, CA 92117 and is currently estimated at $1,611,961, approximately $713 per square foot. 4722 Murat Place is a home located in San Diego County with nearby schools including Alcott Elementary School, Marston Middle School, and Clairemont High School.
Ownership History
Date
Name
Owned For
Owner Type
Purchase Details
Closed on
Apr 26, 2024
Sold by
Pearson David S and Jovanovic Biljana
Bought by
Pearson Declaration Of Trust and Pearson
Current Estimated Value
Purchase Details
Closed on
Mar 13, 2002
Sold by
Pearson David Scott and Jovanovic Biljana
Bought by
Pearson David S and Jovanovic Biljana
Home Financials for this Owner
Home Financials are based on the most recent Mortgage that was taken out on this home.
Original Mortgage
$290,000
Interest Rate
6.99%
Purchase Details
Closed on
May 6, 1999
Sold by
Anthony Petricca and Anthony Jean A
Bought by
Pearson David Scott and Jovanovic Biljana
Home Financials for this Owner
Home Financials are based on the most recent Mortgage that was taken out on this home.
Original Mortgage
$262,400
Interest Rate
7.51%
Create a Home Valuation Report for This Property
The Home Valuation Report is an in-depth analysis detailing your home's value as well as a comparison with similar homes in the area
Home Values in the Area
Average Home Value in this Area
Purchase History
| Date | Buyer | Sale Price | Title Company |
|---|---|---|---|
| Pearson Declaration Of Trust | -- | None Listed On Document | |
| Pearson David S | -- | United Title Company | |
| Pearson David Scott | $328,000 | Southland Title |
Source: Public Records
Mortgage History
| Date | Status | Borrower | Loan Amount |
|---|---|---|---|
| Previous Owner | Pearson David S | $254,950 | |
| Previous Owner | Pearson David S | $266,399 | |
| Previous Owner | Pearson David S | $290,000 | |
| Previous Owner | Pearson David S | $290,000 | |
| Previous Owner | Pearson David Scott | $34,724 | |
| Previous Owner | Pearson David Scott | $262,400 | |
| Previous Owner | Petricca Anthony | $210,000 |
Source: Public Records
Tax History Compared to Growth
Tax History
| Year | Tax Paid | Tax Assessment Tax Assessment Total Assessment is a certain percentage of the fair market value that is determined by local assessors to be the total taxable value of land and additions on the property. | Land | Improvement |
|---|---|---|---|---|
| 2024 | $6,105 | $494,225 | $210,951 | $283,274 |
| 2023 | $5,970 | $484,535 | $206,815 | $277,720 |
| 2022 | $5,726 | $475,035 | $202,760 | $272,275 |
| 2021 | $5,685 | $465,722 | $198,785 | $266,937 |
| 2020 | $5,616 | $460,947 | $196,747 | $264,200 |
| 2019 | $5,514 | $451,910 | $192,890 | $259,020 |
| 2018 | $5,154 | $443,050 | $189,108 | $253,942 |
| 2017 | $81 | $434,363 | $185,400 | $248,963 |
| 2016 | $4,948 | $425,847 | $181,765 | $244,082 |
| 2015 | $4,874 | $419,451 | $179,035 | $240,416 |
| 2014 | $4,796 | $411,235 | $175,528 | $235,707 |
Source: Public Records
Map
Nearby Homes
- 4716 Murat Place
- 4687 Murat Ct
- 2860 Aber St
- 4653 Leathers St
- 2772 Ariane Dr Unit 70
- 2710 Ariane Dr Unit 2
- 2742 Ariane Dr Unit 154
- 2901 Havasupai Ave
- 3146-48 Jemez Dr
- 2864 Havasupai Ave
- 3375 Karok Ave
- 4464 Kamloop Ave
- 3366 Neosho Place
- 4471 Moraga Ave
- 4786 Moraga Ave
- 6013 Oakgate Row
- 3369 Geddes Dr
- 3454 Oak Glen Ln
- 5720 Desert View Dr
- 2826 Palomino Cir
- 4722 Murat Place
- 4728 Murat Place
- 4681 Murat Ct
- 4734 Murat Place
- 4710 Murat Place
- 4675 Murat Ct
- 4552 Hidalgo Ave
- 4562 Hidalgo Ave
- 4542 Hidalgo Ave
- 2915 Murat St
- 4727 Murat Place
- 4706 Murat Place
- 2921 Murat St
- 4721 Murat Place
- 4733 Murat Place
- 2909 Murat St
- 4572 Hidalgo Ave
- 4739 Murat Place
- 4669 Murat Ct
- 4715 Murat Place