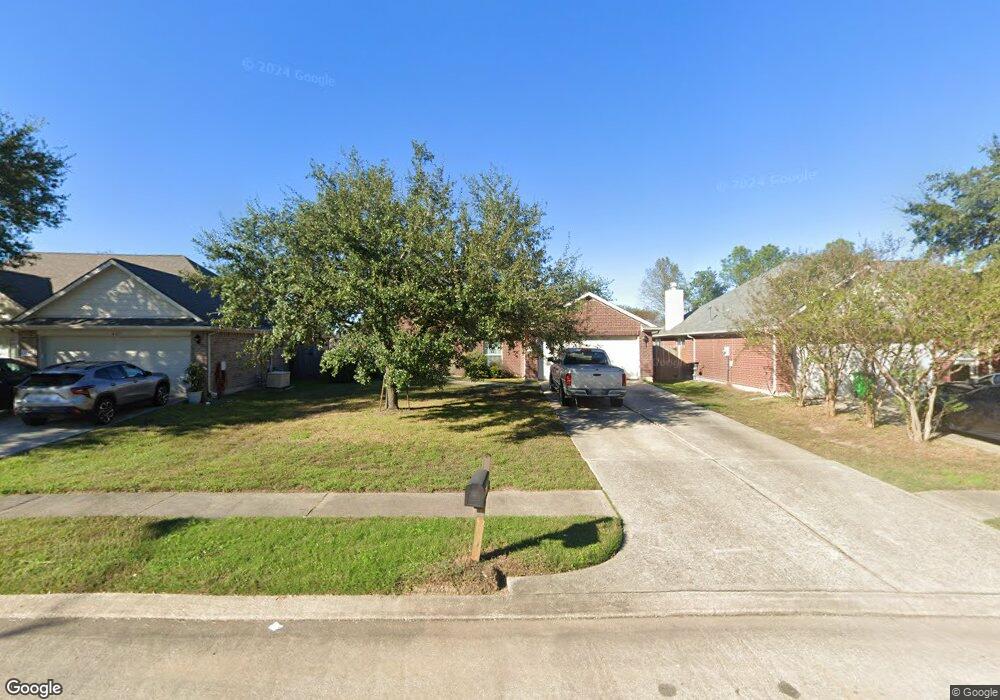
4723 Sagegate Dr Spring, TX 77373
Estimated Value: $244,000 - $288,000
3
Beds
2
Baths
2,060
Sq Ft
$126/Sq Ft
Est. Value
About This Home
This home is located at 4723 Sagegate Dr, Spring, TX 77373 and is currently estimated at $259,603, approximately $126 per square foot. 4723 Sagegate Dr is a home located in Harris County with nearby schools including Chet Burchett Elementary School, Ricky C. Bailey Middle School, and Spring High School.
Ownership History
Date
Name
Owned For
Owner Type
Purchase Details
Closed on
Nov 21, 2007
Sold by
Hud
Bought by
Platenburg Corey P and Mckinney Natasha A
Current Estimated Value
Home Financials for this Owner
Home Financials are based on the most recent Mortgage that was taken out on this home.
Original Mortgage
$99,987
Outstanding Balance
$63,426
Interest Rate
6.43%
Mortgage Type
FHA
Estimated Equity
$196,177
Purchase Details
Closed on
Aug 24, 2007
Sold by
Wachovia Bank Na
Bought by
Hud
Purchase Details
Closed on
Aug 7, 2007
Sold by
Noble Curt D and Noble Stephanie Marie
Bought by
Wachovia Bank Na and Wfasc Mortgage Asset Backed Pass Through
Purchase Details
Closed on
Apr 8, 2004
Sold by
Noble Stephanie Marie
Bought by
Noble Curt Douglas
Purchase Details
Closed on
Jun 14, 2002
Sold by
Choice Homes Inc
Bought by
Noble Curt D and Noble Stephanie Marie
Home Financials for this Owner
Home Financials are based on the most recent Mortgage that was taken out on this home.
Original Mortgage
$129,665
Interest Rate
6.77%
Mortgage Type
FHA
Purchase Details
Closed on
Feb 28, 2002
Sold by
Spring 60 Ltd
Bought by
Choice Homes Inc
Create a Home Valuation Report for This Property
The Home Valuation Report is an in-depth analysis detailing your home's value as well as a comparison with similar homes in the area
Home Values in the Area
Average Home Value in this Area
Purchase History
| Date | Buyer | Sale Price | Title Company |
|---|---|---|---|
| Platenburg Corey P | -- | First American Title | |
| Hud | -- | None Available | |
| Wachovia Bank Na | $128,593 | None Available | |
| Noble Curt Douglas | -- | -- | |
| Noble Curt D | -- | American Title Co | |
| Choice Homes Inc | -- | American Title Co |
Source: Public Records
Mortgage History
| Date | Status | Borrower | Loan Amount |
|---|---|---|---|
| Open | Platenburg Corey P | $99,987 | |
| Previous Owner | Noble Curt D | $129,665 |
Source: Public Records
Tax History
| Year | Tax Paid | Tax Assessment Tax Assessment Total Assessment is a certain percentage of the fair market value that is determined by local assessors to be the total taxable value of land and additions on the property. | Land | Improvement |
|---|---|---|---|---|
| 2025 | $5,221 | $268,918 | $45,091 | $223,827 |
| 2024 | $5,221 | $273,620 | $45,091 | $228,529 |
| 2023 | $5,221 | $267,301 | $45,091 | $222,210 |
| 2022 | $5,436 | $247,323 | $20,935 | $226,388 |
| 2021 | $5,235 | $200,824 | $20,935 | $179,889 |
| 2020 | $5,227 | $188,809 | $20,935 | $167,874 |
| 2019 | $4,925 | $173,090 | $20,935 | $152,155 |
| 2018 | $3,932 | $155,187 | $20,935 | $134,252 |
| 2017 | $4,427 | $155,187 | $20,935 | $134,252 |
| 2016 | $4,171 | $155,187 | $20,935 | $134,252 |
| 2015 | $3,117 | $144,423 | $20,935 | $123,488 |
| 2014 | $3,117 | $136,131 | $20,935 | $115,196 |
Source: Public Records
Map
Nearby Homes
- 4811 Tealgate Dr
- 24022 Rockygate Dr
- 4827 Tealgate Dr
- 4919 Tealgate Dr
- 23815 Firegate Dr
- 4815 Hickorygate Dr
- 4918 Quailgate Dr
- 5019 Colony Hurst Trail
- 5110 Forest Terrace Dr
- 23914 Goodfellow Dr
- 3226 Dappled Vale Trail
- 23314 Sawmill Pass
- 4515 Mossygate Dr
- 23303 Brat Pass Dr
- 4407 Quailgate Dr
- 4803 Blue Jacaranda Way
- 23615 Lady Capulet Dr
- 23827 Lestergate Dr
- 4831 Blue Jacaranda Way
- 4423 Mossygate Dr
- 4727 Sagegate Dr
- 4719 Sagegate Dr
- 4731 Sagegate Dr
- 4807 Edgegate Dr
- 4635 Bridgevillage Dr
- 4726 Bridgevillage Dr
- 4726 Sagegate Dr
- 4730 Sagegate Dr
- 4811 Edgegate Dr
- 4631 Bridgevillage Dr
- 4634 Bridgevillage Dr
- 4714 Pioneer Forest Dr
- 4718 Pioneer Forest Dr
- 4710 Pioneer Forest Dr
- 4802 Edgegate Dr
- 4722 Pioneer Forest Dr
- 4815 Edgegate Dr
- 4706 Pioneer Forest Dr
- 4806 Edgegate Dr
- 24031 Floragate Dr
Your Personal Tour Guide
Ask me questions while you tour the home.