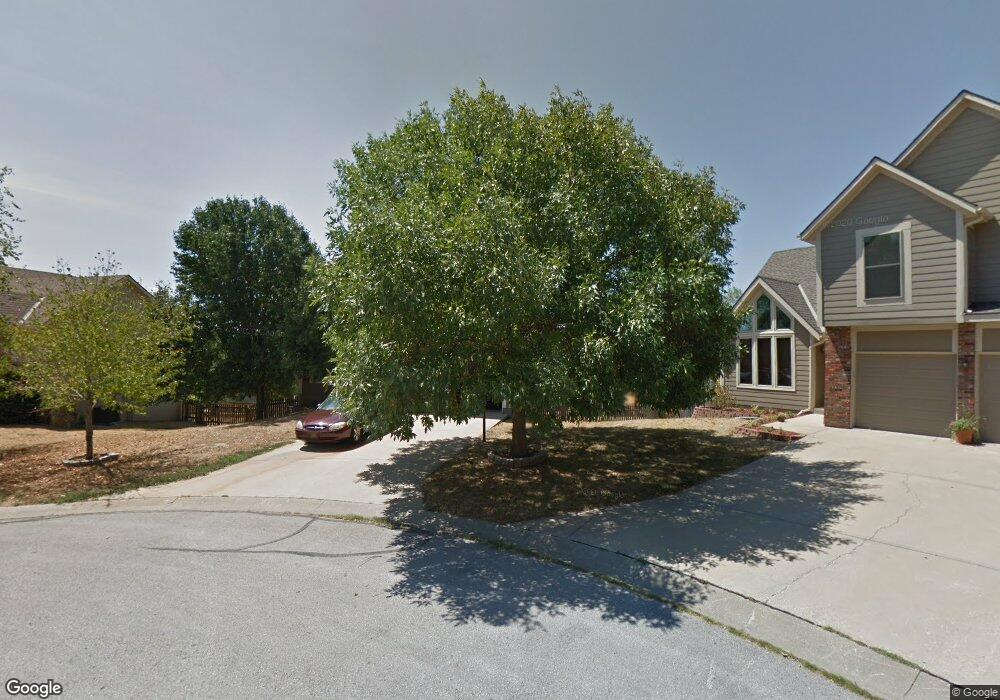
4736 Roundtree Ct Shawnee, KS 66226
Estimated Value: $388,520 - $415,000
3
Beds
3
Baths
1,730
Sq Ft
$232/Sq Ft
Est. Value
About This Home
This home is located at 4736 Roundtree Ct, Shawnee, KS 66226 and is currently estimated at $401,380, approximately $232 per square foot. 4736 Roundtree Ct is a home located in Johnson County with nearby schools including Riverview Elementary School, Mill Creek Middle School, and Mill Valley High School.
Ownership History
Date
Name
Owned For
Owner Type
Purchase Details
Closed on
Apr 30, 2021
Sold by
Nicholson Brian
Bought by
Shaw Oza E
Current Estimated Value
Home Financials for this Owner
Home Financials are based on the most recent Mortgage that was taken out on this home.
Original Mortgage
$111,000
Outstanding Balance
$99,518
Interest Rate
3.1%
Mortgage Type
New Conventional
Estimated Equity
$301,862
Purchase Details
Closed on
Nov 10, 2006
Sold by
Reynoldson Carvel C and Reynoldson Karen C
Bought by
Nicholson Brian and Nicholson Roxanne
Home Financials for this Owner
Home Financials are based on the most recent Mortgage that was taken out on this home.
Original Mortgage
$194,000
Interest Rate
11%
Mortgage Type
Adjustable Rate Mortgage/ARM
Purchase Details
Closed on
Aug 1, 2002
Sold by
Parnell Sherry L and Parnell Charles G
Bought by
Reynoldson Carvel C and Reynoldson Karen C
Home Financials for this Owner
Home Financials are based on the most recent Mortgage that was taken out on this home.
Original Mortgage
$142,800
Interest Rate
6.53%
Create a Home Valuation Report for This Property
The Home Valuation Report is an in-depth analysis detailing your home's value as well as a comparison with similar homes in the area
Home Values in the Area
Average Home Value in this Area
Purchase History
| Date | Buyer | Sale Price | Title Company |
|---|---|---|---|
| Shaw Oza E | -- | Chicago Title Company Llc | |
| Nicholson Brian | -- | Chicago Title Ins Co | |
| Reynoldson Carvel C | -- | Chicago Title Insurance Co |
Source: Public Records
Mortgage History
| Date | Status | Borrower | Loan Amount |
|---|---|---|---|
| Open | Shaw Oza E | $111,000 | |
| Previous Owner | Nicholson Brian | $194,000 | |
| Previous Owner | Reynoldson Carvel C | $142,800 |
Source: Public Records
Tax History
| Year | Tax Paid | Tax Assessment Tax Assessment Total Assessment is a certain percentage of the fair market value that is determined by local assessors to be the total taxable value of land and additions on the property. | Land | Improvement |
|---|---|---|---|---|
| 2025 | $4,741 | $44,781 | $7,920 | $36,861 |
| 2024 | $4,741 | $40,905 | $7,200 | $33,705 |
| 2023 | $4,944 | $42,067 | $7,200 | $34,867 |
| 2022 | $4,534 | $37,801 | $6,853 | $30,948 |
| 2021 | $4,237 | $33,913 | $6,235 | $27,678 |
| 2020 | $3,846 | $30,486 | $5,431 | $25,055 |
| 2019 | $3,704 | $28,923 | $4,500 | $24,423 |
| 2018 | $3,652 | $28,267 | $4,500 | $23,767 |
| 2017 | $3,637 | $27,462 | $3,785 | $23,677 |
| 2016 | $3,462 | $25,818 | $3,785 | $22,033 |
| 2015 | $3,373 | $24,771 | $3,785 | $20,986 |
| 2013 | -- | $21,862 | $3,785 | $18,077 |
Source: Public Records
Map
Nearby Homes
- 4711 Roundtree Ct
- 21610 W 49th St
- 4607 Aminda St
- 5147 Payne St
- 21436 W 48th St
- 9303 Aminda St
- 9313 Aminda St
- 9305 Aminda St
- 9307 Aminda St
- 21526 W 51st Terrace
- 4910 Marion St
- 5314 Brockway St
- 4418 Silverheel St
- 4439 Meadow View Dr
- 5333 Hilltop Dr
- 4531 Woodstock St
- 5425 Payne Ct
- 23508 W 46th St
- 5511 Chouteau St
- 4485 Kansas 7
- 4740 Roundtree Ct
- 4735 Chouteau St
- 4739 Chouteau St
- 4731 Chouteau St
- 4744 Roundtree Ct
- 4743 Chouteau St
- 4727 Roundtree Ct
- 22113 W 47th Terrace
- 22109 W 47th Terrace
- 22117 W 47th Terrace
- 4747 Chouteau St
- 4731 Roundtree Ct
- 4739 Roundtree Ct
- 4735 Roundtree Ct
- 4748 Roundtree Ct
- 22105 W 47th Terrace
- 4743 Roundtree Ct
- 4736 Chouteau St
- 4732 Chouteau St
- 22101 W 47th Terrace
Your Personal Tour Guide
Ask me questions while you tour the home.