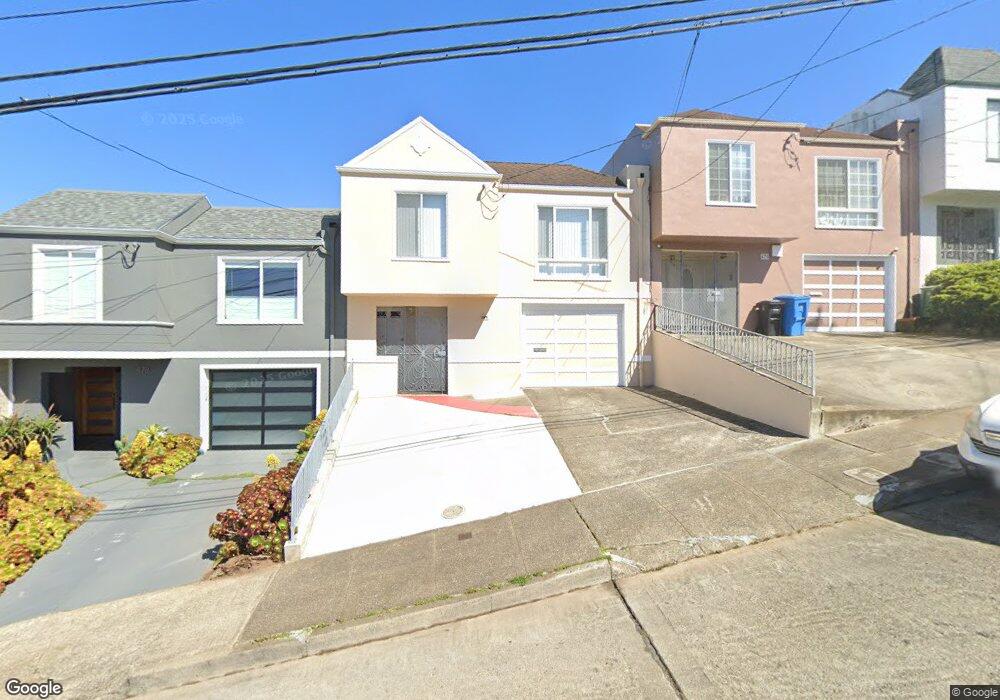
474 Bright St San Francisco, CA 94132
Merced Heights NeighborhoodEstimated Value: $867,000 - $1,234,000
2
Beds
1
Bath
1,098
Sq Ft
$958/Sq Ft
Est. Value
About This Home
This home is located at 474 Bright St, San Francisco, CA 94132 and is currently estimated at $1,051,605, approximately $957 per square foot. 474 Bright St is a home located in San Francisco County with nearby schools including Ortega (Jose) Elementary School, Aptos Middle School, and Leadership High School.
Ownership History
Date
Name
Owned For
Owner Type
Purchase Details
Closed on
Jan 20, 2021
Sold by
Leung Steven and Chiang Wai Kuen
Bought by
Leung Steven and Chiang Wai Kuen
Current Estimated Value
Purchase Details
Closed on
Aug 11, 1998
Sold by
Wing Tsang Kui and Chong Chan Chi
Bought by
Leung Steven and Chiang Wai Kuen
Home Financials for this Owner
Home Financials are based on the most recent Mortgage that was taken out on this home.
Original Mortgage
$180,000
Outstanding Balance
$37,519
Interest Rate
6.91%
Estimated Equity
$1,014,086
Purchase Details
Closed on
Oct 20, 1994
Sold by
Cross Michele and Austin Anne
Bought by
Tsang Kui Wing and Chan Chi Chong
Home Financials for this Owner
Home Financials are based on the most recent Mortgage that was taken out on this home.
Original Mortgage
$85,000
Interest Rate
8.78%
Create a Home Valuation Report for This Property
The Home Valuation Report is an in-depth analysis detailing your home's value as well as a comparison with similar homes in the area
Home Values in the Area
Average Home Value in this Area
Purchase History
| Date | Buyer | Sale Price | Title Company |
|---|---|---|---|
| Leung Steven | -- | None Available | |
| Leung Steven | $233,000 | Old Republic Title Company | |
| Tsang Kui Wing | $205,000 | Old Republic Title Company |
Source: Public Records
Mortgage History
| Date | Status | Borrower | Loan Amount |
|---|---|---|---|
| Open | Leung Steven | $180,000 | |
| Previous Owner | Tsang Kui Wing | $85,000 |
Source: Public Records
Tax History Compared to Growth
Tax History
| Year | Tax Paid | Tax Assessment Tax Assessment Total Assessment is a certain percentage of the fair market value that is determined by local assessors to be the total taxable value of land and additions on the property. | Land | Improvement |
|---|---|---|---|---|
| 2025 | $4,984 | $365,211 | $208,474 | $156,737 |
| 2024 | $4,984 | $358,051 | $204,387 | $153,664 |
| 2023 | $4,900 | $351,033 | $200,381 | $150,652 |
| 2022 | $4,793 | $344,152 | $196,453 | $147,699 |
| 2021 | $4,621 | $337,441 | $192,616 | $144,825 |
| 2020 | $4,659 | $333,981 | $190,641 | $143,340 |
| 2019 | $4,502 | $327,433 | $186,903 | $140,530 |
| 2018 | $4,350 | $321,014 | $183,239 | $137,775 |
| 2017 | $3,999 | $314,721 | $179,647 | $135,074 |
| 2016 | $3,908 | $308,551 | $176,125 | $132,426 |
| 2015 | $3,857 | $303,917 | $173,480 | $130,437 |
| 2014 | $3,755 | $297,964 | $170,082 | $127,882 |
Source: Public Records
Map
Nearby Homes