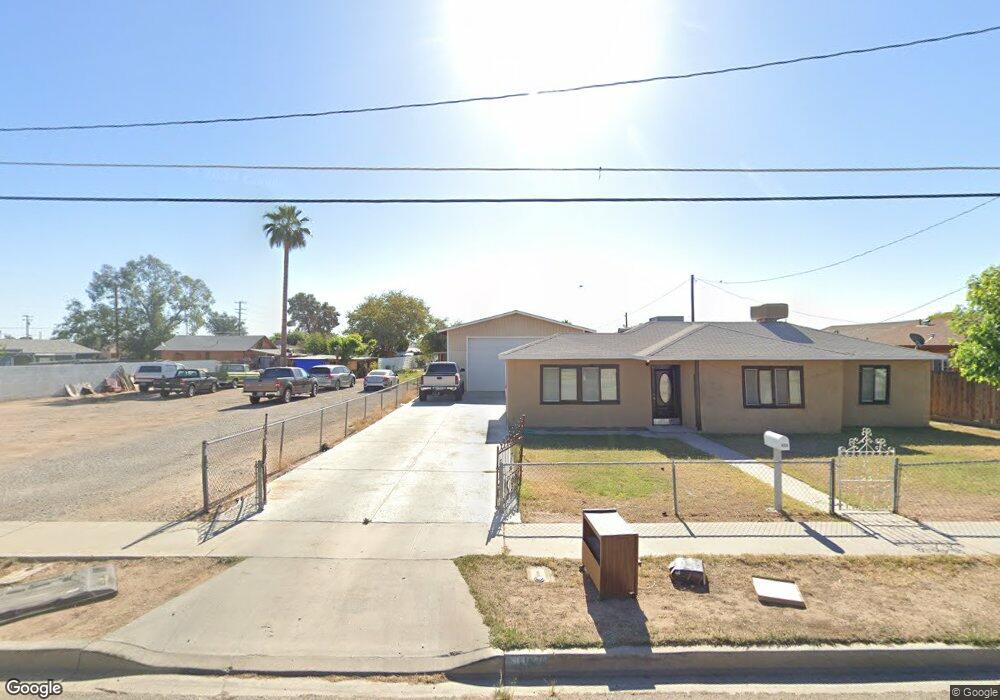
474 N 3rd St Blythe, CA 92225
Estimated Value: $144,393 - $264,000
2
Beds
2
Baths
783
Sq Ft
$245/Sq Ft
Est. Value
About This Home
This home is located at 474 N 3rd St, Blythe, CA 92225 and is currently estimated at $191,598, approximately $244 per square foot. 474 N 3rd St is a home located in Riverside County with nearby schools including Palo Verde High School and Scale Leadership Academy - East.
Ownership History
Date
Name
Owned For
Owner Type
Purchase Details
Closed on
Jun 29, 2012
Sold by
Hernandez Pedro A
Bought by
Hernandez Celia X
Current Estimated Value
Purchase Details
Closed on
Aug 14, 2000
Sold by
Hernandez Josefina T
Bought by
Hernandez Pedro A
Home Financials for this Owner
Home Financials are based on the most recent Mortgage that was taken out on this home.
Original Mortgage
$32,000
Interest Rate
8.2%
Purchase Details
Closed on
Jul 18, 2000
Sold by
Stumpf Jenny Creighton and Vandeloop Cynthia A
Bought by
Hernandez Pedro A and Hernandez Celia
Home Financials for this Owner
Home Financials are based on the most recent Mortgage that was taken out on this home.
Original Mortgage
$32,000
Interest Rate
8.2%
Purchase Details
Closed on
Apr 10, 2000
Sold by
Stumpf Juanita Creighton and Vandeloop Cynthia A
Bought by
Armenta Teresa F
Home Financials for this Owner
Home Financials are based on the most recent Mortgage that was taken out on this home.
Original Mortgage
$56,000
Interest Rate
8.22%
Create a Home Valuation Report for This Property
The Home Valuation Report is an in-depth analysis detailing your home's value as well as a comparison with similar homes in the area
Home Values in the Area
Average Home Value in this Area
Purchase History
| Date | Buyer | Sale Price | Title Company |
|---|---|---|---|
| Hernandez Celia X | -- | None Available | |
| Hernandez Pedro A | -- | First American Title Co | |
| Hernandez Pedro A | $38,000 | First American Title Co | |
| Armenta Teresa F | $70,000 | Fidelity National Title Co |
Source: Public Records
Mortgage History
| Date | Status | Borrower | Loan Amount |
|---|---|---|---|
| Closed | Hernandez Pedro A | $32,000 | |
| Previous Owner | Armenta Teresa F | $56,000 |
Source: Public Records
Tax History
| Year | Tax Paid | Tax Assessment Tax Assessment Total Assessment is a certain percentage of the fair market value that is determined by local assessors to be the total taxable value of land and additions on the property. | Land | Improvement |
|---|---|---|---|---|
| 2025 | $1,077 | $104,279 | $36,865 | $67,414 |
| 2023 | $1,077 | $100,233 | $35,435 | $64,798 |
| 2022 | $1,006 | $95,920 | $33,941 | $61,979 |
| 2021 | $802 | $77,983 | $27,594 | $50,389 |
| 2020 | $710 | $69,628 | $24,638 | $44,990 |
| 2019 | $695 | $67,600 | $23,920 | $43,680 |
| 2018 | $636 | $65,000 | $23,000 | $42,000 |
| 2017 | $561 | $58,000 | $21,000 | $37,000 |
| 2016 | $556 | $57,000 | $20,000 | $37,000 |
| 2015 | $516 | $53,000 | $20,000 | $33,000 |
| 2014 | $506 | $53,000 | $20,000 | $33,000 |
Source: Public Records
Map
Nearby Homes
- 0 N 4th St
- 290 N 3rd St
- 266 Shannon St
- 630 N 6th St
- 0 SW 1 4 of Sec 25 Tp 6 S R 20 E Unit RS26038543
- 0 Blythe Unit 219122850DA
- 0 Blythe Unit 219122849DA
- 0 Blythe Unit PW26026036
- 460 N Sola Ave
- 301 N Sola Ave
- 340 N Sola Ave
- 9481 N Broadway
- 361 N 9th St
- 370 N 9th St
- 158 Eunice Cir
- 145 Eunice Cir
- 340 N 9th St
- 155 N 1st St
- 161 Eunice Cir
- 260 E Oasis St
Your Personal Tour Guide
Ask me questions while you tour the home.