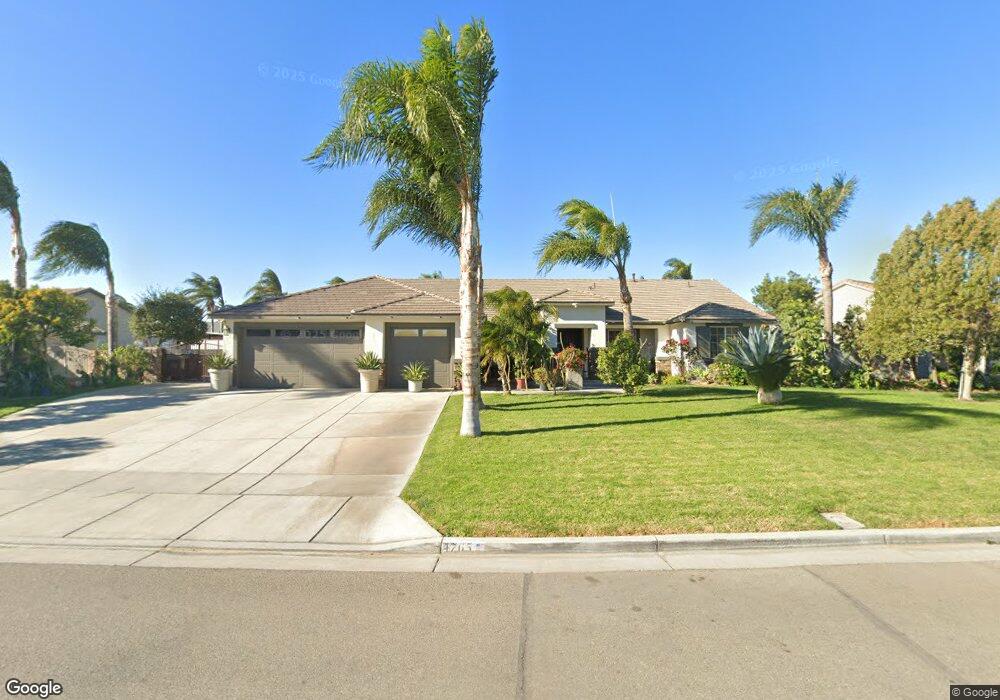
4765 Rockingham Loop Riverside, CA 92509
Estimated Value: $913,914 - $1,144,000
4
Beds
2
Baths
2,708
Sq Ft
$389/Sq Ft
Est. Value
About This Home
This home is located at 4765 Rockingham Loop, Riverside, CA 92509 and is currently estimated at $1,054,729, approximately $389 per square foot. 4765 Rockingham Loop is a home located in Riverside County with nearby schools including Van Buren Elementary School, Mira Loma Middle School, and Jurupa Valley High School.
Ownership History
Date
Name
Owned For
Owner Type
Purchase Details
Closed on
Jan 12, 2011
Sold by
Moreno Angelica
Bought by
Moreno Alfredo
Current Estimated Value
Purchase Details
Closed on
Dec 17, 2010
Sold by
Boll Brian S
Bought by
Moreno Alfredo
Purchase Details
Closed on
Feb 14, 2005
Sold by
Boll Brian S and Boll Lisa
Bought by
Boll Brian S
Home Financials for this Owner
Home Financials are based on the most recent Mortgage that was taken out on this home.
Original Mortgage
$423,000
Interest Rate
6.25%
Mortgage Type
Purchase Money Mortgage
Purchase Details
Closed on
Jun 10, 2003
Sold by
Tract 28808 Llc
Bought by
Boll Brian S and Boll Lisa
Home Financials for this Owner
Home Financials are based on the most recent Mortgage that was taken out on this home.
Original Mortgage
$304,617
Interest Rate
4.37%
Mortgage Type
Purchase Money Mortgage
Create a Home Valuation Report for This Property
The Home Valuation Report is an in-depth analysis detailing your home's value as well as a comparison with similar homes in the area
Home Values in the Area
Average Home Value in this Area
Purchase History
| Date | Buyer | Sale Price | Title Company |
|---|---|---|---|
| Moreno Alfredo | -- | Lawyers Title | |
| Moreno Alfredo | $360,000 | Lawyers Title | |
| Boll Brian S | -- | Fidelity National Title Co | |
| Boll Brian S | $381,000 | Orange Coast Title Company |
Source: Public Records
Mortgage History
| Date | Status | Borrower | Loan Amount |
|---|---|---|---|
| Previous Owner | Boll Brian S | $423,000 | |
| Previous Owner | Boll Brian S | $304,617 | |
| Closed | Boll Brian S | $57,115 |
Source: Public Records
Tax History
| Year | Tax Paid | Tax Assessment Tax Assessment Total Assessment is a certain percentage of the fair market value that is determined by local assessors to be the total taxable value of land and additions on the property. | Land | Improvement |
|---|---|---|---|---|
| 2025 | $6,744 | $461,208 | $192,168 | $269,040 |
| 2023 | $6,744 | $443,300 | $184,706 | $258,594 |
| 2022 | $6,546 | $434,609 | $181,085 | $253,524 |
| 2021 | $6,461 | $426,088 | $177,535 | $248,553 |
| 2020 | $6,383 | $421,720 | $175,715 | $246,005 |
| 2019 | $6,266 | $413,452 | $172,270 | $241,182 |
| 2018 | $6,101 | $405,346 | $168,893 | $236,453 |
| 2017 | $6,013 | $397,399 | $165,582 | $231,817 |
| 2016 | $5,923 | $389,608 | $162,336 | $227,272 |
| 2015 | $5,839 | $383,758 | $159,899 | $223,859 |
| 2014 | $5,509 | $376,243 | $156,768 | $219,475 |
Source: Public Records
Map
Nearby Homes
- 4715 Bain St
- 4856 Poinsetta Place
- 9920 Jurupa Rd
- 9931 Union St
- 10544 48th St
- 9861 Mission Blvd Unit 14
- 9600 51st St
- 4052 Lindsay St
- 4311 Glenroy Ct
- 10025 Mission Blvd
- 5484 Street Cedar
- 9291 Pleasant Hurst Ct
- 5445 Cedar St
- 9468 Hastings Blvd
- 10230 56th St
- 10538 54th St
- 0 Felspar St Unit DW25190204
- 9342 Hastings Blvd
- 5641 Rutile St
- 9237 53rd St
- 4729 Rockingham Loop
- 4801 Rockingham Loop
- 10068 Kings Ct
- 10104 Kings Ct
- 4792 Rockingham Loop
- 4774 Rockingham Loop
- 4819 Rockingham Loop
- 4756 Rockingham Loop
- 4738 Rockingham Loop
- 4810 Rockingham Loop
- 10140 Kings Ct
- 4720 Rockingham Loop
- 10077 Kings Ct
- 4675 Rockingham Loop
- 4837 Rockingham Loop
- 10061 Woodbridge Ln
- 10043 Woodbridge Ln
- 4828 Rockingham Loop
- 4702 Rockingham Loop
- 10095 Kings Ct
Your Personal Tour Guide
Ask me questions while you tour the home.