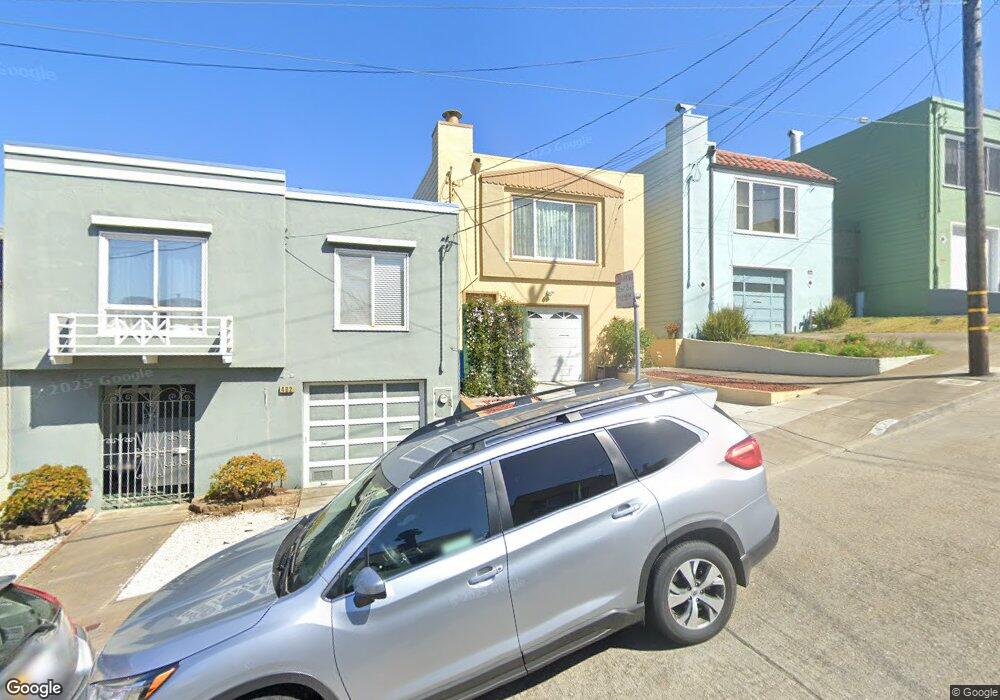
478 Arch St San Francisco, CA 94132
Merced Heights NeighborhoodEstimated Value: $1,229,000 - $1,484,000
3
Beds
3
Baths
1,793
Sq Ft
$758/Sq Ft
Est. Value
About This Home
This home is located at 478 Arch St, San Francisco, CA 94132 and is currently estimated at $1,358,807, approximately $757 per square foot. 478 Arch St is a home located in San Francisco County with nearby schools including Ortega (Jose) Elementary School, Aptos Middle School, and Stratford School.
Ownership History
Date
Name
Owned For
Owner Type
Purchase Details
Closed on
Aug 4, 2019
Sold by
Weng Chung Pang Wilson and Pang Peggy Liu
Bought by
Weng Chung Pang Wilson and Liu Pang Peggy
Current Estimated Value
Purchase Details
Closed on
Mar 15, 2012
Sold by
Pang Wilson Weng Chung and Pang Peggy Liu
Bought by
Pang Wilson Weng Chung and Pang Peggy Liu
Purchase Details
Closed on
Oct 17, 2002
Sold by
Chew Soi Kim
Bought by
Pang Wilson Weng Chung and Pang Peggy Liu
Home Financials for this Owner
Home Financials are based on the most recent Mortgage that was taken out on this home.
Original Mortgage
$388,000
Interest Rate
6.12%
Create a Home Valuation Report for This Property
The Home Valuation Report is an in-depth analysis detailing your home's value as well as a comparison with similar homes in the area
Home Values in the Area
Average Home Value in this Area
Purchase History
| Date | Buyer | Sale Price | Title Company |
|---|---|---|---|
| Weng Chung Pang Wilson | -- | None Available | |
| Weng Chung Pang Wilson | -- | None Available | |
| Pang Wilson Weng Chung | $198,500 | None Available | |
| Pang Wilson Weng Chung | $485,000 | Financial Title |
Source: Public Records
Mortgage History
| Date | Status | Borrower | Loan Amount |
|---|---|---|---|
| Previous Owner | Pang Wilson Weng Chung | $388,000 | |
| Closed | Pang Wilson Weng Chung | $72,750 |
Source: Public Records
Tax History Compared to Growth
Tax History
| Year | Tax Paid | Tax Assessment Tax Assessment Total Assessment is a certain percentage of the fair market value that is determined by local assessors to be the total taxable value of land and additions on the property. | Land | Improvement |
|---|---|---|---|---|
| 2025 | $8,880 | $770,654 | $421,454 | $349,200 |
| 2024 | $8,880 | $755,545 | $413,191 | $342,354 |
| 2023 | $8,752 | $740,732 | $405,090 | $335,642 |
| 2022 | $8,596 | $726,209 | $397,148 | $329,061 |
| 2021 | $8,447 | $711,971 | $389,361 | $322,610 |
| 2020 | $8,472 | $704,672 | $385,369 | $319,303 |
| 2019 | $8,181 | $690,828 | $377,803 | $313,025 |
| 2018 | $7,906 | $677,214 | $370,356 | $306,858 |
| 2017 | $7,812 | $663,939 | $363,095 | $300,844 |
| 2016 | $7,672 | $650,922 | $355,976 | $294,946 |
| 2015 | $7,845 | $641,147 | $350,630 | $290,517 |
| 2014 | $7,638 | $628,591 | $343,763 | $284,828 |
Source: Public Records
Map
Nearby Homes