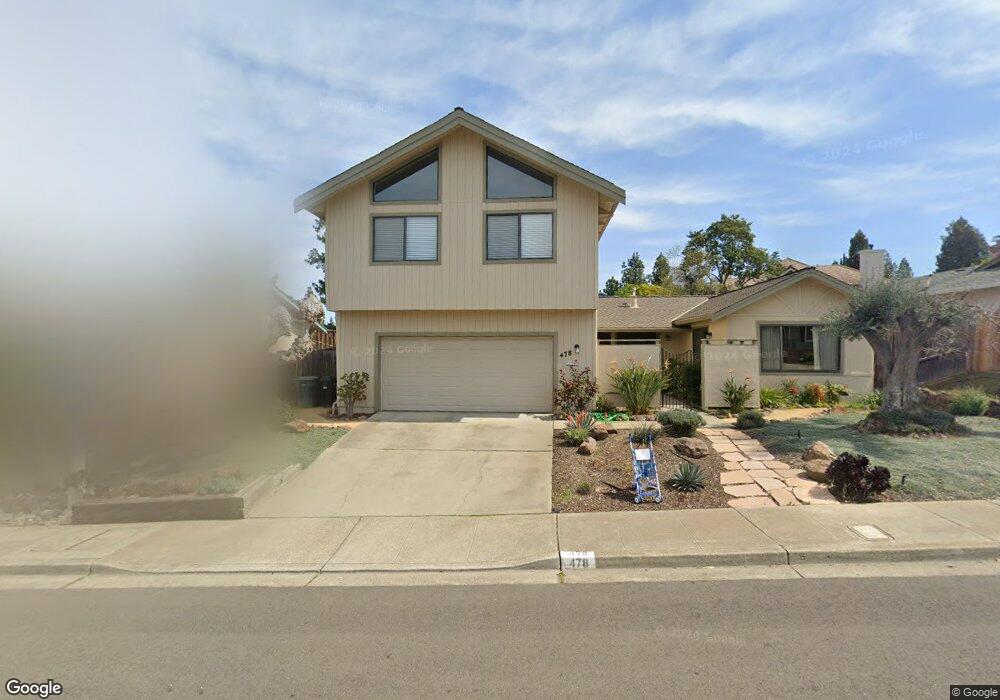
478 Ewing Dr Pleasanton, CA 94566
Estimated Value: $1,890,981 - $2,170,000
7
Beds
4
Baths
3,200
Sq Ft
$638/Sq Ft
Est. Value
About This Home
This home is located at 478 Ewing Dr, Pleasanton, CA 94566 and is currently estimated at $2,041,495, approximately $637 per square foot. 478 Ewing Dr is a home located in Alameda County with nearby schools including Valley View Elementary School, Pleasanton Middle School, and Amador Valley High School.
Ownership History
Date
Name
Owned For
Owner Type
Purchase Details
Closed on
Mar 20, 2018
Sold by
Hirst Frances L and Frances L Hirst Trust
Bought by
Hirst William A and Hirst Frances L
Current Estimated Value
Purchase Details
Closed on
Mar 15, 2010
Sold by
Hirst Frances L
Bought by
Hirst Frances L and Frances L Hirst Trust
Purchase Details
Closed on
Oct 18, 2001
Sold by
Hirst William and Hirst Frances L
Bought by
Hirst William Arthur and Hirst Frances Louise
Home Financials for this Owner
Home Financials are based on the most recent Mortgage that was taken out on this home.
Original Mortgage
$106,000
Interest Rate
6.87%
Purchase Details
Closed on
Aug 6, 1998
Sold by
Hirst William A and Hirst Frances Louise
Bought by
Hirst William Arthur and Hirst Frances Louise
Create a Home Valuation Report for This Property
The Home Valuation Report is an in-depth analysis detailing your home's value as well as a comparison with similar homes in the area
Purchase History
| Date | Buyer | Sale Price | Title Company |
|---|---|---|---|
| Hirst William A | -- | None Available | |
| Hirst Frances L | -- | None Available | |
| Hirst Frances L | -- | None Available | |
| Hirst William A | -- | None Available | |
| Hirst William Arthur | -- | New Century Title Company | |
| Hirst William | -- | New Century Title Company | |
| Hirst William Arthur | -- | -- |
Source: Public Records
Mortgage History
| Date | Status | Borrower | Loan Amount |
|---|---|---|---|
| Previous Owner | Hirst William | $106,000 |
Source: Public Records
Tax History
| Year | Tax Paid | Tax Assessment Tax Assessment Total Assessment is a certain percentage of the fair market value that is determined by local assessors to be the total taxable value of land and additions on the property. | Land | Improvement |
|---|---|---|---|---|
| 2025 | $1,856 | $153,667 | $18,721 | $141,946 |
| 2024 | $1,856 | $150,517 | $18,354 | $139,163 |
| 2023 | $1,832 | $154,428 | $17,994 | $136,434 |
| 2022 | $1,736 | $144,402 | $17,642 | $133,760 |
| 2021 | $1,690 | $141,433 | $17,296 | $131,137 |
| 2020 | $1,668 | $146,911 | $17,118 | $129,793 |
| 2019 | $1,685 | $144,031 | $16,783 | $127,248 |
| 2018 | $1,650 | $141,207 | $16,454 | $124,753 |
| 2017 | $1,608 | $138,438 | $16,131 | $122,307 |
| 2016 | $1,478 | $135,724 | $15,815 | $119,909 |
| 2015 | $1,450 | $133,685 | $15,577 | $118,108 |
| 2014 | $1,473 | $131,067 | $15,272 | $115,795 |
Source: Public Records
Map
Nearby Homes
- 601 Palomino Dr Unit D
- 601 Palomino Dr Unit C
- 389 Mavis Dr
- 691 Concord Place
- 3375 Norton Way Unit 5
- 327 Linden Way
- 215 Mavis Dr
- 3845 Vineyard Ave Unit F
- 3841 Vineyard Ave Unit 18
- 3839 Vineyard Ave Unit 45
- 351 Christina Ct
- 3877 Vine St
- 1282 Vintner Way
- 3263 Vineyard Ave Unit 44
- 3263 Vineyard Ave Unit 68
- 3263 Vineyard Ave Unit 35
- 3263 Vineyard Ave Unit 62
- 3263 Vineyard Ave Unit 132
- 3263 Vineyard Ave Unit 89
- 3231 Vineyard Ave Unit 141
Your Personal Tour Guide
Ask me questions while you tour the home.