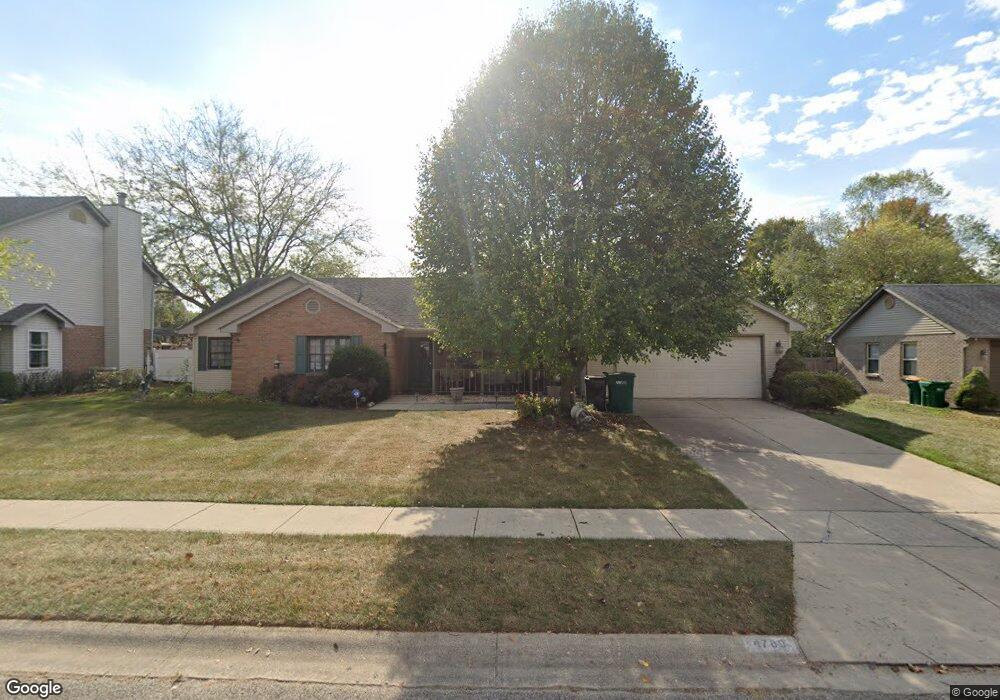
4789 Fox Run Fairborn, OH 45324
Estimated Value: $326,000 - $353,000
3
Beds
3
Baths
1,973
Sq Ft
$172/Sq Ft
Est. Value
About This Home
This home is located at 4789 Fox Run, Fairborn, OH 45324 and is currently estimated at $339,842, approximately $172 per square foot. 4789 Fox Run is a home located in Clark County with nearby schools including Greenon Elementary School, Greenon Jr. High School, and Greenon High School.
Ownership History
Date
Name
Owned For
Owner Type
Purchase Details
Closed on
Jun 2, 2010
Sold by
Roth Gregory and Roth Diana
Bought by
Todd Sharon M and Todd Harry L
Current Estimated Value
Home Financials for this Owner
Home Financials are based on the most recent Mortgage that was taken out on this home.
Original Mortgage
$217,076
Outstanding Balance
$145,019
Interest Rate
5.14%
Mortgage Type
FHA
Estimated Equity
$194,823
Purchase Details
Closed on
Mar 27, 2006
Sold by
Roth Gregory and Roth Diana
Bought by
Roth Gregory and Roth Diana
Purchase Details
Closed on
Apr 30, 2002
Sold by
Christensen Richard A and Christensen Jean Velma
Bought by
Roth Gregory and Mccreery Diana
Home Financials for this Owner
Home Financials are based on the most recent Mortgage that was taken out on this home.
Original Mortgage
$180,400
Interest Rate
7.07%
Mortgage Type
Purchase Money Mortgage
Purchase Details
Closed on
Oct 12, 1993
Create a Home Valuation Report for This Property
The Home Valuation Report is an in-depth analysis detailing your home's value as well as a comparison with similar homes in the area
Home Values in the Area
Average Home Value in this Area
Purchase History
| Date | Buyer | Sale Price | Title Company |
|---|---|---|---|
| Todd Sharon M | $220,000 | Chamberlin Title Agency Ltd | |
| Roth Gregory | -- | First American | |
| Roth Gregory | -- | -- | |
| -- | $145,000 | -- |
Source: Public Records
Mortgage History
| Date | Status | Borrower | Loan Amount |
|---|---|---|---|
| Open | Todd Sharon M | $217,076 | |
| Previous Owner | Roth Gregory | $180,400 |
Source: Public Records
Tax History
| Year | Tax Paid | Tax Assessment Tax Assessment Total Assessment is a certain percentage of the fair market value that is determined by local assessors to be the total taxable value of land and additions on the property. | Land | Improvement |
|---|---|---|---|---|
| 2025 | $3,950 | $112,390 | $20,210 | $92,180 |
| 2024 | $3,890 | $83,030 | $19,620 | $63,410 |
| 2023 | $3,890 | $83,030 | $19,620 | $63,410 |
| 2022 | $3,908 | $83,030 | $19,620 | $63,410 |
| 2021 | $3,849 | $73,570 | $15,690 | $57,880 |
| 2020 | $3,859 | $73,570 | $15,690 | $57,880 |
| 2019 | $3,911 | $73,570 | $15,690 | $57,880 |
| 2018 | $3,418 | $64,560 | $14,330 | $50,230 |
| 2017 | $3,454 | $71,152 | $14,329 | $56,823 |
| 2016 | $3,013 | $71,152 | $14,329 | $56,823 |
| 2015 | $3,019 | $65,181 | $13,647 | $51,534 |
| 2014 | $2,812 | $61,902 | $13,647 | $48,255 |
| 2013 | $2,493 | $61,902 | $13,647 | $48,255 |
Source: Public Records
Map
Nearby Homes
- 7850 Kings Ridge Cir
- 7050 Creekside Cir
- 6 Danzig Ln
- 2133 Willow Run Cir Unit 2133
- 2151 Willow Run Cir Unit 2151
- 0 Enon Xenia Rd
- 5221 Ottawa Dr
- 5463 Enon-Xenia Rd
- 0 Enon-Xenia Rd
- 4600 Snider Rd
- 4538 Cynthia Dr
- 4024 Raymond Dr
- 4200 Phillips St
- 144 Matthews Ave
- 3924 Schenley St
- 6250 Fairfield Pike
- 46-48 W Main St
- 199 Fairfield Pike
- 141 N Xenia Dr
- 1010 Meadow Lark Dr
- 4769 Fox Run
- 4823 Fox Run
- 4788 Steeple Chase Dr
- 4753 Fox Run
- 4853 Fox Run
- 4770 Steeple Chase Dr
- 4822 Steeple Chase Dr
- 4802 Fox Run
- 4776 Fox Run
- 4754 Steeple Chase Dr
- 7820 Kings Ridge Cir
- 4836 Fox Run
- 7836 Kings Ridge Cir
- 4727 Fox Run
- 4754 Fox Run
- 4887 Fox Run
- 4728 Steeple Chase Dr
- 4868 Fox Run
- 4728 Fox Run
- 4701 Fox Run
Your Personal Tour Guide
Ask me questions while you tour the home.