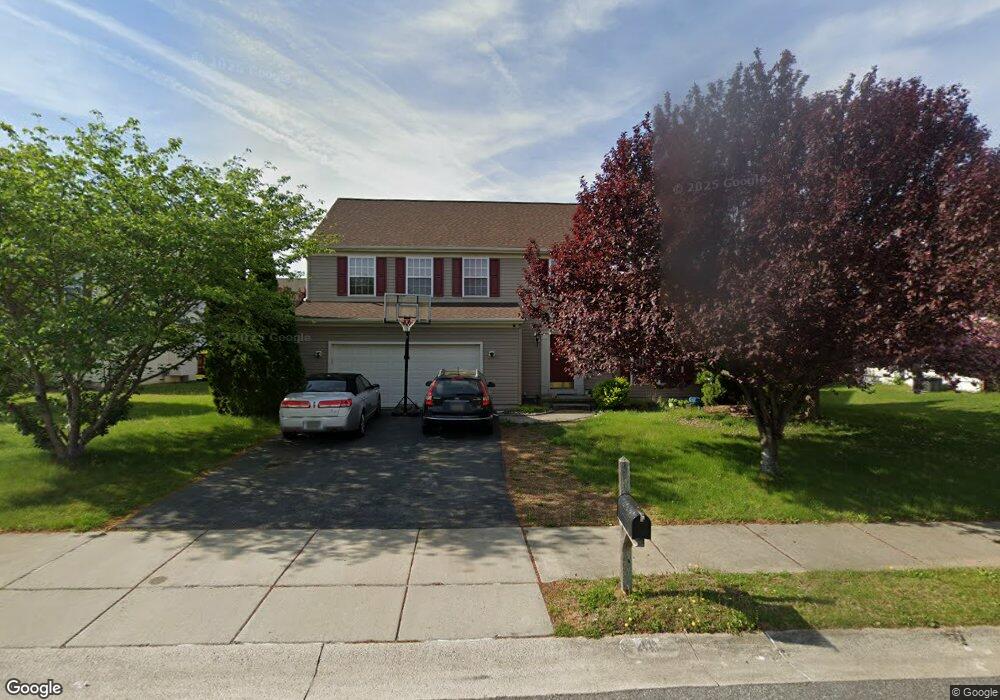
48 E Redbrook Place Smyrna, DE 19977
Estimated Value: $419,000 - $461,000
4
Beds
3
Baths
2,096
Sq Ft
$206/Sq Ft
Est. Value
About This Home
This home is located at 48 E Redbrook Place, Smyrna, DE 19977 and is currently estimated at $432,625, approximately $206 per square foot. 48 E Redbrook Place is a home located in Kent County with nearby schools including John Bassett Moore Intermediate School, Smyrna Elementary School, and Smyrna Middle School.
Ownership History
Date
Name
Owned For
Owner Type
Purchase Details
Closed on
Jun 26, 2018
Sold by
Gyening Brobbey and Akoto Marsha
Bought by
Henderson Patricia A
Current Estimated Value
Home Financials for this Owner
Home Financials are based on the most recent Mortgage that was taken out on this home.
Original Mortgage
$252,310
Outstanding Balance
$218,664
Interest Rate
4.5%
Mortgage Type
VA
Estimated Equity
$213,961
Purchase Details
Closed on
Aug 16, 2016
Sold by
Mccarty Sherie A
Bought by
Gyening Brobbey and Akoto Marsha
Purchase Details
Closed on
Nov 16, 2005
Sold by
Nvr Inc
Bought by
Mccarty Sherie A
Home Financials for this Owner
Home Financials are based on the most recent Mortgage that was taken out on this home.
Original Mortgage
$216,000
Interest Rate
8.62%
Mortgage Type
Assumption
Purchase Details
Closed on
Aug 11, 2005
Sold by
Twin Willows Development Llc
Bought by
Nvr Inc
Create a Home Valuation Report for This Property
The Home Valuation Report is an in-depth analysis detailing your home's value as well as a comparison with similar homes in the area
Home Values in the Area
Average Home Value in this Area
Purchase History
| Date | Buyer | Sale Price | Title Company |
|---|---|---|---|
| Henderson Patricia A | $247,000 | None Available | |
| Gyening Brobbey | $238,000 | Attorney | |
| Mccarty Sherie A | $273,195 | None Available | |
| Nvr Inc | $100,000 | None Available |
Source: Public Records
Mortgage History
| Date | Status | Borrower | Loan Amount |
|---|---|---|---|
| Open | Henderson Patricia A | $252,310 | |
| Previous Owner | Mccarty Sherie A | $216,000 |
Source: Public Records
Tax History
| Year | Tax Paid | Tax Assessment Tax Assessment Total Assessment is a certain percentage of the fair market value that is determined by local assessors to be the total taxable value of land and additions on the property. | Land | Improvement |
|---|---|---|---|---|
| 2025 | $1,935 | $357,200 | $116,900 | $240,300 |
| 2024 | $1,916 | $357,200 | $116,900 | $240,300 |
| 2023 | $1,808 | $52,400 | $5,300 | $47,100 |
| 2022 | $1,734 | $52,400 | $5,300 | $47,100 |
| 2021 | $1,698 | $52,400 | $5,300 | $47,100 |
| 2020 | $1,520 | $52,400 | $5,300 | $47,100 |
| 2019 | $1,341 | $52,400 | $5,300 | $47,100 |
| 2018 | $1,528 | $52,400 | $5,300 | $47,100 |
| 2017 | $1,559 | $53,900 | $0 | $0 |
| 2016 | $1,520 | $53,900 | $0 | $0 |
| 2015 | -- | $53,900 | $0 | $0 |
| 2014 | -- | $53,900 | $0 | $0 |
Source: Public Records
Map
Nearby Homes
- 114 E Cayhill Ln
- 250 E Braeburn Dr
- 42 Southall Ct Unit JACKSON
- 166 Southall Ct Unit CHARLESTON GRAND
- 106 Southall Ct
- 106 Southall Ct Unit CHARLESTON GRAND
- 106 Southall Ct Unit ABBOTT
- 106 Southall Ct Unit BRANDYWINE
- 106 Southall Ct Unit HANCOCK
- 106 Southall Ct Unit BERKSHIRE
- 106 Southall Ct Unit CHARLESTON
- 200 Spring Meadow Dr
- 132 Winston Ct
- 18 Frenchmans Branch Dr
- 64 Larkspur Ln
- 0 S Dupont Blvd Unit DEKT2042444
- 6 Frenchmans Branch Dr Unit 6
- 7 Windy Way
- Lot 16 Dodge Dr
- 543 Sorrell Cir
- 48 E Redbrook Place
- 32 E Redbrook Place
- 66 E Redbrook Place
- 47 E Wellington Mews
- 31 E Wellington Mews
- 14 E Redbrook Place
- 65 E Wellington Mews
- 33 E Redbrook Place
- 13 E Wellington Mews
- 17 E Redbrook Place
- 46 E Wellington Mews
- 15 W Redbrook Place
- 32 E Wellington Mews
- 64 E Wellington Mews
- 14 E Wellington Mews
- 16 W Redbrook Place
- 74 E Wellington Mews
- 29 W Redbrook Place
- 28 W Wellington Mews
- 15 W Wellington Mews
Your Personal Tour Guide
Ask me questions while you tour the home.