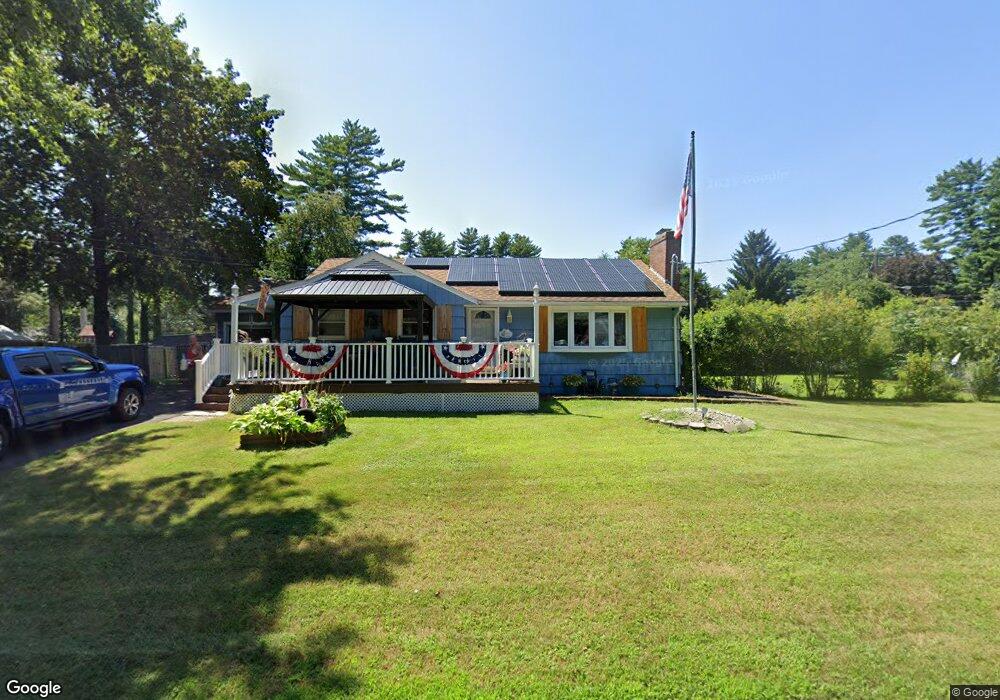
48 Flint St Springfield, MA 01129
Boston Road NeighborhoodEstimated Value: $277,000 - $342,000
2
Beds
2
Baths
1,102
Sq Ft
$285/Sq Ft
Est. Value
About This Home
This home is located at 48 Flint St, Springfield, MA 01129 and is currently estimated at $314,370, approximately $285 per square foot. 48 Flint St is a home located in Hampden County with nearby schools including Warner, M Marcus Kiley Middle, and Springfield Central High School.
Ownership History
Date
Name
Owned For
Owner Type
Purchase Details
Closed on
Dec 15, 1998
Sold by
Krueger Michael J and Glushien Christina K
Bought by
Tremblay Gerard N and Larose Tara A
Current Estimated Value
Home Financials for this Owner
Home Financials are based on the most recent Mortgage that was taken out on this home.
Original Mortgage
$77,965
Interest Rate
6.8%
Mortgage Type
Purchase Money Mortgage
Create a Home Valuation Report for This Property
The Home Valuation Report is an in-depth analysis detailing your home's value as well as a comparison with similar homes in the area
Home Values in the Area
Average Home Value in this Area
Purchase History
| Date | Buyer | Sale Price | Title Company |
|---|---|---|---|
| Tremblay Gerard N | $78,500 | -- |
Source: Public Records
Mortgage History
| Date | Status | Borrower | Loan Amount |
|---|---|---|---|
| Open | Tremblay Gerard N | $156,400 | |
| Closed | Tremblay Gerard N | $77,965 |
Source: Public Records
Tax History
| Year | Tax Paid | Tax Assessment Tax Assessment Total Assessment is a certain percentage of the fair market value that is determined by local assessors to be the total taxable value of land and additions on the property. | Land | Improvement |
|---|---|---|---|---|
| 2025 | $4,717 | $300,800 | $60,700 | $240,100 |
| 2024 | $4,484 | $279,200 | $60,700 | $218,500 |
| 2023 | $3,979 | $233,400 | $57,800 | $175,600 |
| 2022 | $4,142 | $220,100 | $57,800 | $162,300 |
| 2021 | $3,727 | $197,200 | $52,600 | $144,600 |
| 2020 | $3,568 | $182,700 | $52,600 | $130,100 |
| 2019 | $3,330 | $169,200 | $52,600 | $116,600 |
| 2018 | $3,171 | $171,300 | $52,600 | $118,700 |
| 2017 | $3,171 | $161,300 | $47,600 | $113,700 |
| 2016 | $3,059 | $155,600 | $47,600 | $108,000 |
| 2015 | $3,017 | $153,400 | $47,600 | $105,800 |
Source: Public Records
Map
Nearby Homes
Your Personal Tour Guide
Ask me questions while you tour the home.