4804 Brooks St Montclair, CA 91763
Estimated Value: $2,824,154
Studio
--
Bath
10,848
Sq Ft
$260/Sq Ft
Est. Value
About This Home
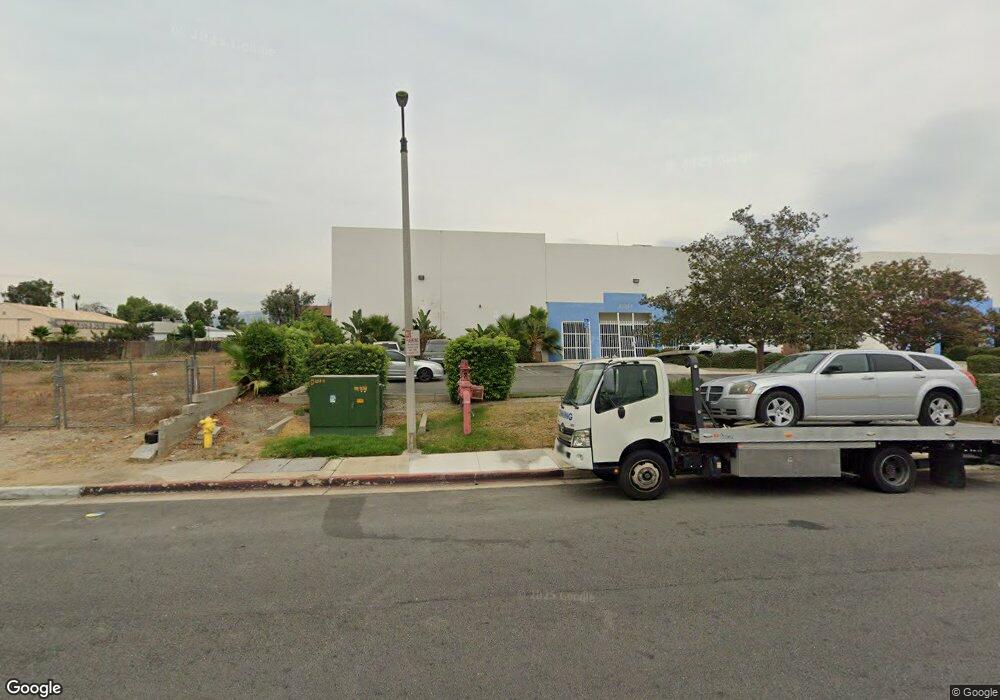
This home is located at 4804 Brooks St, Montclair, CA 91763 and is currently estimated at $2,824,154, approximately $260 per square foot. 4804 Brooks St is a home located in San Bernardino County with nearby schools including Montera Elementary School, Serrano Middle School, and Montclair High School.
Ownership History
Date
Name
Owned For
Owner Type
Purchase Details
Closed on
May 24, 2018
Sold by
Clark Andrew K and Clark Cheryl K
Bought by
Chino Enterprises Holdings Llc
Current Estimated Value
Home Financials for this Owner
Home Financials are based on the most recent Mortgage that was taken out on this home.
Original Mortgage
$870,000
Outstanding Balance
$749,099
Interest Rate
4.4%
Mortgage Type
Future Advance Clause Open End Mortgage
Estimated Equity
$2,075,055
Purchase Details
Closed on
Jun 6, 2016
Sold by
Hartigan Mary C
Bought by
The Clark Family Trust
Home Financials for this Owner
Home Financials are based on the most recent Mortgage that was taken out on this home.
Original Mortgage
$400,000
Interest Rate
3.66%
Mortgage Type
Commercial
Purchase Details
Closed on
May 17, 2007
Sold by
Kelly Patrick J
Bought by
Kelly Patrick J and Pmk Family Trust
Purchase Details
Closed on
Apr 12, 1995
Sold by
Kelly Patrick J
Bought by
Kelly Patrick J and Kelly Margaret A
Create a Home Valuation Report for This Property
The Home Valuation Report is an in-depth analysis detailing your home's value as well as a comparison with similar homes in the area
Home Values in the Area
Average Home Value in this Area
Purchase History
| Date | Buyer | Sale Price | Title Company |
|---|---|---|---|
| Chino Enterprises Holdings Llc | $1,810,000 | Chicago Title Company | |
| The Clark Family Trust | $1,015,000 | Chicago Title Company | |
| Kelly Patrick J | -- | None Available | |
| Kelly Patrick J | -- | -- | |
| Kelly Patrick J | -- | -- |
Source: Public Records
Mortgage History
| Date | Status | Borrower | Loan Amount |
|---|---|---|---|
| Open | Chino Enterprises Holdings Llc | $870,000 | |
| Previous Owner | The Clark Family Trust | $400,000 |
Source: Public Records
Tax History
| Year | Tax Paid | Tax Assessment Tax Assessment Total Assessment is a certain percentage of the fair market value that is determined by local assessors to be the total taxable value of land and additions on the property. | Land | Improvement |
|---|---|---|---|---|
| 2025 | $22,576 | $2,059,472 | $415,308 | $1,644,164 |
| 2024 | $22,063 | $2,019,090 | $407,165 | $1,611,925 |
| 2023 | $21,442 | $1,979,500 | $399,181 | $1,580,319 |
| 2022 | $21,160 | $1,940,686 | $391,354 | $1,549,332 |
| 2021 | $21,030 | $1,902,633 | $383,680 | $1,518,953 |
| 2020 | $20,660 | $1,883,124 | $379,746 | $1,503,378 |
| 2019 | $20,483 | $1,846,200 | $372,300 | $1,473,900 |
| 2018 | $11,797 | $1,056,006 | $369,862 | $686,144 |
| 2017 | $11,373 | $1,035,300 | $362,610 | $672,690 |
| 2016 | $5,966 | $519,231 | $105,250 | $413,981 |
| 2015 | $5,563 | $511,432 | $103,669 | $407,763 |
| 2014 | $5,390 | $501,413 | $101,638 | $399,775 |
Source: Public Records
Map
Nearby Homes
- 4790 Brooks St
- 4902 Manzanita St
- 4903 Bandera St
- 4543 Bodega Ct Unit 90
- 4512 Donner Ct
- 4545 Canoga St
- 10995 Coalinga Ave
- 10593 Mills Ave
- 5170 San Clemente Way
- 11000 Kimberly Ave
- 4444 Merle St
- 5219 Belvedere Way
- 4361 Mission Blvd Unit 80
- 5394 Evart St
- 4317 Clair St
- 11250 Ramona Ave Unit 216
- 11250 Ramona Ave
- 11250 Ramona Ave Unit 210
- 4175 Rudisill St
- 1667 E Kingsley Ave
- 4810 Brooks St
- 4776 Brooks St
- 4795 Holt Blvd Unit 111
- 4795 Holt Blvd Unit 101
- 747 Brooks St
- 4771 Holt Blvd
- 4747 Holt Blvd
- 4773 Brooks St
- 4739 Brooks St
- 4790 Holt Blvd
- 4749A Holt Blvd
- 4749 Holt Blvd
- 4715 Brooks St
- 0 Brooks Unit W11141254
- 0 Brooks Unit CC316280
- 0 Brooks Unit TR15198706
- 0 Brooks Unit AR17083040
- 0 Brooks Unit 314031804
- 0 Brooks St Unit AR14103959
- 0 Brooks St Unit AR17083018
Your Personal Tour Guide
Ask me questions while you tour the home.