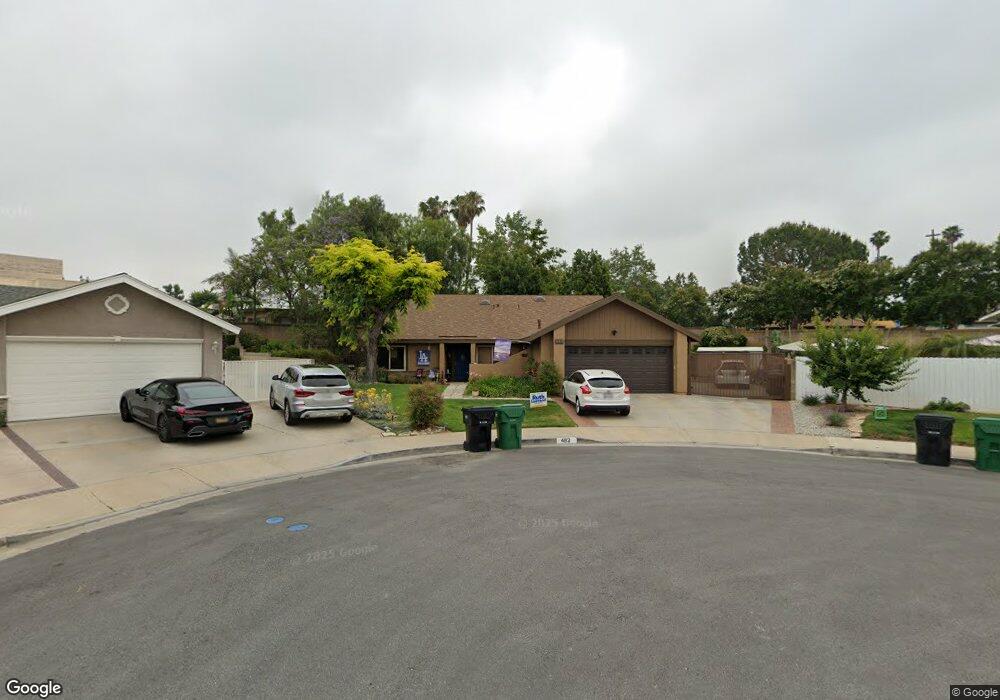
482 Balboa Ct San Dimas, CA 91773
Estimated Value: $879,128 - $978,000
4
Beds
2
Baths
1,825
Sq Ft
$512/Sq Ft
Est. Value
About This Home
This home is located at 482 Balboa Ct, San Dimas, CA 91773 and is currently estimated at $934,282, approximately $511 per square foot. 482 Balboa Ct is a home located in Los Angeles County with nearby schools including Fred Ekstrand Elementary School, Lone Hill Middle School, and San Dimas High School.
Ownership History
Date
Name
Owned For
Owner Type
Purchase Details
Closed on
Dec 10, 2021
Sold by
Neprasch Thomas A and Neprasch Irma
Bought by
Neprasch Famly Trust
Current Estimated Value
Purchase Details
Closed on
Dec 8, 2000
Sold by
Neprasch Thomas A and Neprasch Irma
Bought by
Neprasch Thomas A and Neprasch Irma
Home Financials for this Owner
Home Financials are based on the most recent Mortgage that was taken out on this home.
Original Mortgage
$194,200
Interest Rate
7.81%
Create a Home Valuation Report for This Property
The Home Valuation Report is an in-depth analysis detailing your home's value as well as a comparison with similar homes in the area
Home Values in the Area
Average Home Value in this Area
Purchase History
| Date | Buyer | Sale Price | Title Company |
|---|---|---|---|
| Neprasch Famly Trust | -- | Law Office Of Jennifer L Field | |
| Neprasch Thomas A | -- | American Title Co |
Source: Public Records
Mortgage History
| Date | Status | Borrower | Loan Amount |
|---|---|---|---|
| Previous Owner | Neprasch Thomas A | $194,200 |
Source: Public Records
Tax History
| Year | Tax Paid | Tax Assessment Tax Assessment Total Assessment is a certain percentage of the fair market value that is determined by local assessors to be the total taxable value of land and additions on the property. | Land | Improvement |
|---|---|---|---|---|
| 2025 | $2,730 | $185,676 | $43,003 | $142,673 |
| 2024 | $2,730 | $182,036 | $42,160 | $139,876 |
| 2023 | $2,672 | $178,468 | $41,334 | $137,134 |
| 2022 | $2,625 | $174,970 | $40,524 | $134,446 |
| 2021 | $2,564 | $171,540 | $39,730 | $131,810 |
| 2019 | $2,516 | $166,453 | $38,552 | $127,901 |
| 2018 | $2,307 | $163,191 | $37,797 | $125,394 |
| 2016 | $2,204 | $156,856 | $36,330 | $120,526 |
| 2015 | $2,172 | $154,501 | $35,785 | $118,716 |
| 2014 | $2,163 | $151,476 | $35,085 | $116,391 |
Source: Public Records
Map
Nearby Homes
- 330 Moore Ln
- 433 N Shaftesbury Ave
- 317 Pony Express Rd
- 254 E 4th St
- 208 E 3rd St
- 2737 Pattiglen Ave
- 214 E 4th St
- 215 Elderberry St
- 819 N Shaftesbury Ave
- 402 E De Anza Heights Dr
- 150 S Monte Vista Ave
- 909 Lotus Cir
- 0 E De Anza Heights Dr
- 694 Rosewood Ln
- 224 W Railway St
- 680 Redwood Ln
- 236 W 1st St
- 0 Dallas Rd Unit WS25141209
- 850 Tucson Ct
- 927 Sonora Ct
Your Personal Tour Guide
Ask me questions while you tour the home.