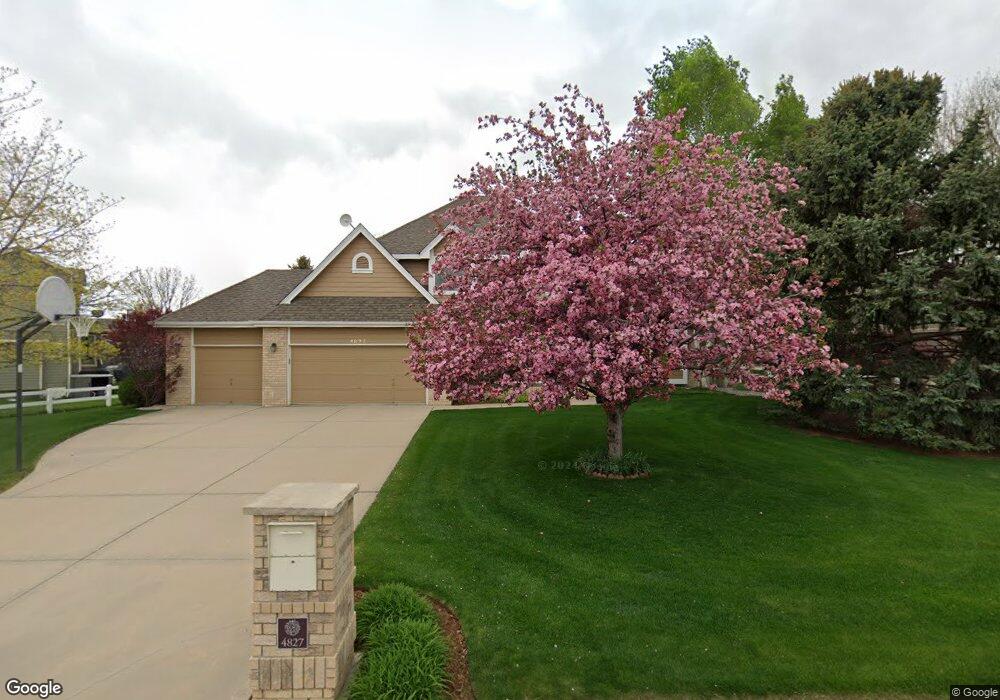
4827 Broadmoor Ct Fort Collins, CO 80528
Estimated Value: $707,661 - $757,000
4
Beds
4
Baths
2,095
Sq Ft
$350/Sq Ft
Est. Value
About This Home
This home is located at 4827 Broadmoor Ct, Fort Collins, CO 80528 and is currently estimated at $733,415, approximately $350 per square foot. 4827 Broadmoor Ct is a home located in Larimer County with nearby schools including Colorado Early Colleges Windsor, Westgate KinderCare, and Resurrection Christian School.
Ownership History
Date
Name
Owned For
Owner Type
Purchase Details
Closed on
Oct 28, 2020
Sold by
Teslow Michael A and Teslow Shannon C
Bought by
Teslow Michael A
Current Estimated Value
Purchase Details
Closed on
Oct 29, 1998
Sold by
Teslow Michael A and Stryker Teslow Shannon C
Bought by
Teslow Michael A and Teslow Shannon C
Home Financials for this Owner
Home Financials are based on the most recent Mortgage that was taken out on this home.
Original Mortgage
$163,800
Interest Rate
6.57%
Purchase Details
Closed on
Sep 1, 1995
Sold by
Jensen D Homes Inc
Bought by
Stryker-Teslow Shannon C
Purchase Details
Closed on
Mar 1, 1995
Sold by
Hillside Commercial Group Inc
Bought by
Jensen D Homes Inc
Purchase Details
Closed on
Dec 1, 1994
Sold by
Darden Dorothy M By Aif
Bought by
Hillside Commercial Group Inc
Create a Home Valuation Report for This Property
The Home Valuation Report is an in-depth analysis detailing your home's value as well as a comparison with similar homes in the area
Home Values in the Area
Average Home Value in this Area
Purchase History
| Date | Buyer | Sale Price | Title Company |
|---|---|---|---|
| Teslow Michael A | -- | None Available | |
| Teslow Michael A | -- | -- | |
| Stryker-Teslow Shannon C | $215,600 | -- | |
| Jensen D Homes Inc | $39,000 | -- | |
| Hillside Commercial Group Inc | $81,100 | -- |
Source: Public Records
Mortgage History
| Date | Status | Borrower | Loan Amount |
|---|---|---|---|
| Closed | Teslow Michael A | $163,800 |
Source: Public Records
Tax History Compared to Growth
Tax History
| Year | Tax Paid | Tax Assessment Tax Assessment Total Assessment is a certain percentage of the fair market value that is determined by local assessors to be the total taxable value of land and additions on the property. | Land | Improvement |
|---|---|---|---|---|
| 2025 | $4,740 | $48,970 | $13,400 | $35,570 |
| 2024 | $4,531 | $48,970 | $13,400 | $35,570 |
| 2022 | $3,721 | $35,994 | $7,179 | $28,815 |
| 2021 | $3,757 | $37,030 | $7,386 | $29,644 |
| 2020 | $3,458 | $33,791 | $7,386 | $26,405 |
| 2019 | $3,470 | $33,791 | $7,386 | $26,405 |
| 2018 | $3,125 | $31,436 | $7,438 | $23,998 |
| 2017 | $3,119 | $31,436 | $7,438 | $23,998 |
| 2016 | $3,111 | $31,196 | $8,223 | $22,973 |
| 2015 | $3,075 | $31,190 | $8,220 | $22,970 |
| 2014 | $2,682 | $26,880 | $8,220 | $18,660 |
Source: Public Records
Map
Nearby Homes
- 0 Tract Q Windsor Villages Unit 1031195
- 5483 Shadow Creek Ct
- 0 Royal Vista Cir Unit RECIR1019271
- 0 Tract P Windsor Villages Unit 1031194
- 5502 Shady Oaks Dr
- 5820 Shady Oaks Ct
- 5304 Vardon Way
- 7309 Didrickson Ct
- 8119 Lighthouse Ln
- 5390 Promontory Cir
- 5013 Country Farms Dr
- 5256 Augusta Trail
- 0 Colorado 392
- 5442 Tiller Ct
- 7271 Irwin Ct
- 5375 Trade Wind Ct
- 6505 Ankina Dr
- 8420 SE Frontage Rd
- 6497 Ankina Dr
- 8412 Cromwell Cir
- 4923 Broadmoor Ct
- 4819 Broadmoor Ct
- 4848 Crestone Cir
- 4844 Crestone Cir
- 4832 Broadmoor Ct
- 4811 Broadmoor Ct
- 4824 Broadmoor Ct
- 4918 Broadmoor Ct
- 4816 Broadmoor Ct
- 7762 Hathaway Ln
- 4836 Crestone Cir
- 4926 Broadmoor Ct
- 7754 Hathaway Ln
- 4934 Broadmoor Ct
- 4847 Crestone Cir
- 4839 Crestone Cir
- 4985 N Hathaway Ln
- 7814 Hathaway Ln
- 4986 N Hathaway Ln
- 4868 Twin Peaks Cir