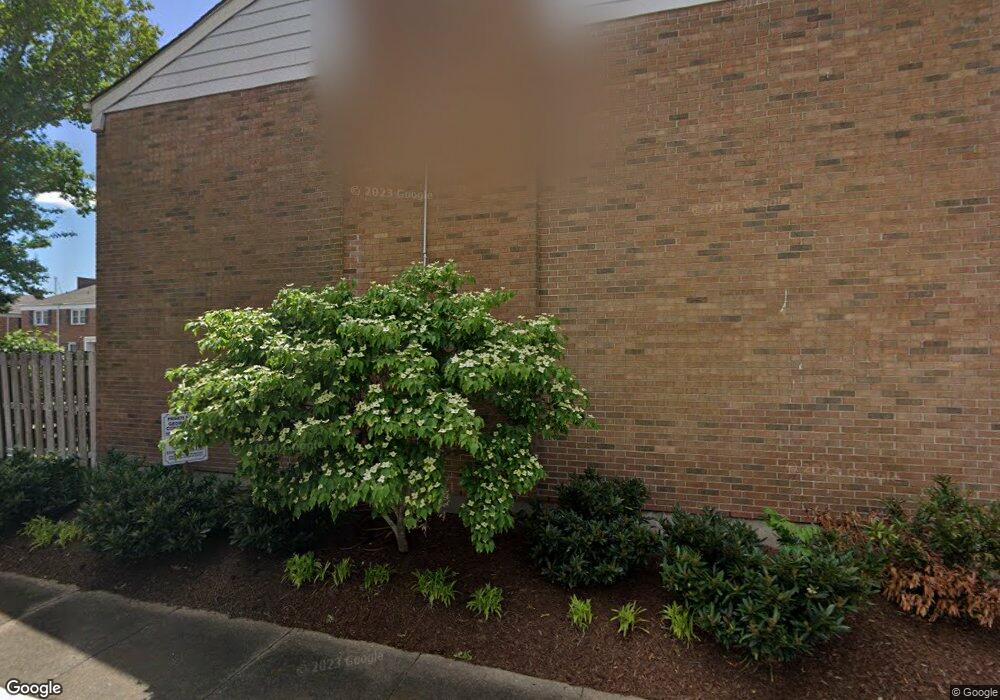
483 Bridge St Unit 6H Hampton, VA 23669
Victoria Boulevard Historic District NeighborhoodEstimated Value: $158,000 - $214,000
2
Beds
2
Baths
1,028
Sq Ft
$181/Sq Ft
Est. Value
About This Home
This home is located at 483 Bridge St Unit 6H, Hampton, VA 23669 and is currently estimated at $186,362, approximately $181 per square foot. 483 Bridge St Unit 6H is a home located in Hampton City with nearby schools including Bassette Elementary School, C. Alton Lindsay Middle School, and Phoebus High School.
Ownership History
Date
Name
Owned For
Owner Type
Purchase Details
Closed on
May 19, 2025
Sold by
Sullivan Colin M
Bought by
Head Adam
Current Estimated Value
Purchase Details
Closed on
Sep 15, 2021
Sold by
Paulden David W and Paulden Caron L
Bought by
Sullivan Colin M
Home Financials for this Owner
Home Financials are based on the most recent Mortgage that was taken out on this home.
Original Mortgage
$170,022
Interest Rate
2.8%
Mortgage Type
VA
Purchase Details
Closed on
Jul 25, 2019
Sold by
Montague David N
Bought by
Paulden David W and Paulden Caron L
Home Financials for this Owner
Home Financials are based on the most recent Mortgage that was taken out on this home.
Original Mortgage
$48,750
Interest Rate
3.82%
Mortgage Type
New Conventional
Purchase Details
Closed on
Mar 28, 2006
Sold by
Dwyer Frances J
Bought by
Montague David N
Home Financials for this Owner
Home Financials are based on the most recent Mortgage that was taken out on this home.
Original Mortgage
$153,000
Interest Rate
6.32%
Mortgage Type
New Conventional
Create a Home Valuation Report for This Property
The Home Valuation Report is an in-depth analysis detailing your home's value as well as a comparison with similar homes in the area
Home Values in the Area
Average Home Value in this Area
Purchase History
| Date | Buyer | Sale Price | Title Company |
|---|---|---|---|
| Head Adam | $157,948 | Westcor Land Title | |
| Sullivan Colin M | $166,200 | Attorney | |
| Paulden David W | $65,000 | Peninsula Ittle Company Inc | |
| Montague David N | $170,000 | -- |
Source: Public Records
Mortgage History
| Date | Status | Borrower | Loan Amount |
|---|---|---|---|
| Previous Owner | Sullivan Colin M | $170,022 | |
| Previous Owner | Paulden David W | $48,750 | |
| Previous Owner | Montague David N | $153,000 |
Source: Public Records
Tax History
| Year | Tax Paid | Tax Assessment Tax Assessment Total Assessment is a certain percentage of the fair market value that is determined by local assessors to be the total taxable value of land and additions on the property. | Land | Improvement |
|---|---|---|---|---|
| 2025 | $2,128 | $173,100 | $47,300 | $125,800 |
| 2024 | $1,987 | $172,800 | $47,300 | $125,500 |
| 2023 | $1,963 | $169,200 | $47,300 | $121,900 |
| 2022 | $1,913 | $162,100 | $44,700 | $117,400 |
| 2021 | $1,517 | $116,600 | $37,300 | $79,300 |
| 2020 | $1,399 | $112,800 | $32,900 | $79,900 |
| 2019 | $1,384 | $111,600 | $32,900 | $78,700 |
| 2018 | $1,628 | $111,500 | $32,900 | $78,600 |
| 2017 | $1,477 | $0 | $0 | $0 |
| 2016 | $1,477 | $111,500 | $0 | $0 |
| 2015 | $1,780 | $0 | $0 | $0 |
| 2014 | $1,845 | $136,000 | $32,900 | $103,100 |
Source: Public Records
Map
Nearby Homes
- 116 Linden Ave
- 144 Meredith St
- 4 Cedar Point Dr
- 4408 Victoria Blvd
- 159 Columbia Ave
- 163 Columbia Ave
- 241 Newport News Ave
- 19 Capps Quarters Unit 1
- 27 Bacon St
- 19 Capps Qtrs Unit 1
- 19 Capps Qtrs
- 6 Capps Qtrs Unit 2
- 233 Mill Point Dr
- 301 Washington St
- 430 Newport News Ave
- 357 W Queen St
- 363 W Queen St
- 115 E Pembroke Ave
- 418 Wine St
- 373 W Queen St
- 483 Bridge St
- 485 Bridge St
- 487 Bridge St
- 487 Bridge St Unit 6F
- 489 Bridge St
- 491 Bridge St
- 415 Bridge St
- 415 Bridge St Unit 1A
- 493 Bridge St
- 413 Bridge St
- 413 Bridge St Unit 1-B
- 495 Bridge St
- 495 Bridge St Unit 6B
- 411 Bridge St
- 497 Bridge St Unit 497
- 409 Bridge St
- 481 Bridge St
- 479 Bridge St
- 479 Bridge St Unit 5G
- 407 Bridge St
Your Personal Tour Guide
Ask me questions while you tour the home.