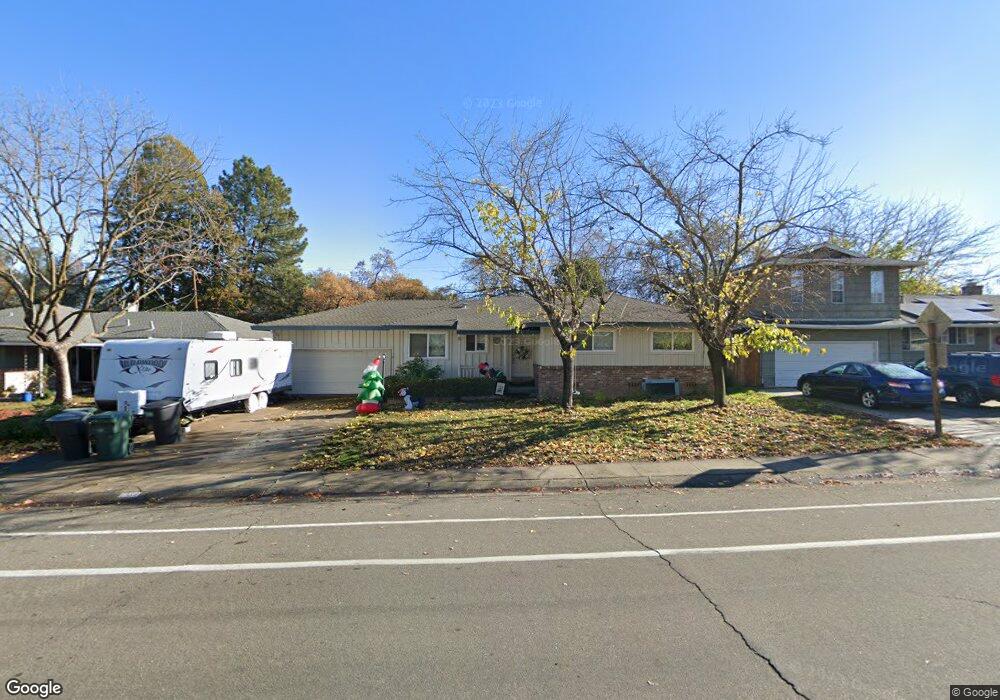
4834 Crestview Dr Carmichael, CA 95608
Estimated Value: $488,000 - $553,000
3
Beds
2
Baths
1,368
Sq Ft
$372/Sq Ft
Est. Value
About This Home
This home is located at 4834 Crestview Dr, Carmichael, CA 95608 and is currently estimated at $509,343, approximately $372 per square foot. 4834 Crestview Dr is a home located in Sacramento County with nearby schools including Thomas Kelly Elementary School, John Barrett Middle School, and Del Campo High School.
Ownership History
Date
Name
Owned For
Owner Type
Purchase Details
Closed on
Sep 24, 2014
Sold by
Hiles Russell E and Hiles Monica
Bought by
Franklin Michael D and Franklin Roslyn M
Current Estimated Value
Home Financials for this Owner
Home Financials are based on the most recent Mortgage that was taken out on this home.
Original Mortgage
$256,155
Outstanding Balance
$197,756
Interest Rate
4.37%
Mortgage Type
FHA
Estimated Equity
$311,587
Purchase Details
Closed on
Jun 29, 2012
Sold by
Hiles Russell E
Bought by
Hiles Russell E and Hiles Monica
Purchase Details
Closed on
Jan 25, 2010
Sold by
Hiles Joan C
Bought by
Hiles Russell E and Hiles Joan C
Home Financials for this Owner
Home Financials are based on the most recent Mortgage that was taken out on this home.
Original Mortgage
$50,000
Interest Rate
4.91%
Mortgage Type
New Conventional
Purchase Details
Closed on
Jun 9, 2004
Sold by
Hiles Joan C
Bought by
Hiles Joan C and Joan C Hiles Revocable Trust
Create a Home Valuation Report for This Property
The Home Valuation Report is an in-depth analysis detailing your home's value as well as a comparison with similar homes in the area
Home Values in the Area
Average Home Value in this Area
Purchase History
| Date | Buyer | Sale Price | Title Company |
|---|---|---|---|
| Franklin Michael D | $265,000 | Nrth American Title Company | |
| Hiles Russell E | -- | None Available | |
| Hiles Russell E | -- | None Available | |
| Hiles Russell E | -- | North American Title Company | |
| Hiles Joan C | -- | North American Title Company | |
| Hiles Joan C | -- | -- |
Source: Public Records
Mortgage History
| Date | Status | Borrower | Loan Amount |
|---|---|---|---|
| Open | Franklin Michael D | $256,155 | |
| Previous Owner | Hiles Joan C | $50,000 |
Source: Public Records
Tax History
| Year | Tax Paid | Tax Assessment Tax Assessment Total Assessment is a certain percentage of the fair market value that is determined by local assessors to be the total taxable value of land and additions on the property. | Land | Improvement |
|---|---|---|---|---|
| 2025 | $2,386 | $207,850 | $58,583 | $149,267 |
| 2024 | $2,386 | $203,776 | $57,435 | $146,341 |
| 2023 | $2,347 | $199,781 | $56,309 | $143,472 |
| 2022 | $2,298 | $195,864 | $55,205 | $140,659 |
| 2021 | $2,259 | $192,024 | $54,123 | $137,901 |
| 2020 | $2,216 | $190,056 | $53,569 | $136,487 |
| 2019 | $2,408 | $186,330 | $52,519 | $133,811 |
| 2018 | $2,143 | $182,678 | $51,490 | $131,188 |
| 2017 | $2,121 | $179,097 | $50,481 | $128,616 |
| 2016 | $1,980 | $175,587 | $49,492 | $126,095 |
| 2015 | $1,990 | $172,950 | $48,749 | $124,201 |
| 2014 | $981 | $79,374 | $17,187 | $62,187 |
Source: Public Records
Map
Nearby Homes
- 4823 Schuyler Dr
- 4907 Crestview Dr
- 6008 Rye Way
- 0 Secluded Oaks Ln Unit 224011893
- 4904 Manzanita Ave
- 4952 Oleander Dr
- 6395 Perrin Way
- 5106 Mckinney Way
- 5831 Verde Cruz Way
- 5865 Esrig Way
- 6430 Sandstone St
- 4701 Pedersen Way
- 5935 Denver Dr
- 5805 Muldrow Rd
- 5861 Muldrow Rd
- 6636 Saint James Dr
- 5811 Muldrow Rd
- 5220 Lynnadeane Ct
- 5262 Flagstone St
- 6123 Longmont Way
- 4840 Crestview Dr
- 4828 Crestview Dr
- 4846 Crestview Dr
- 4822 Crestview Dr
- 6131 Vernal Way
- 4823 Crestview Dr
- 4852 Crestview Dr
- 4845 Crestview Dr
- 4840 Jan Dr
- 6123 Vernal Way
- 4817 Crestview Dr
- 4858 Crestview Dr
- 4851 Crestview Dr
- 6124 Vernal Way
- 6115 Vernal Way
- 4857 Crestview Dr
- 4864 Crestview Dr
- 4811 Etna Ct
- 6116 Vernal Way
- 4809 Etna Ct
Your Personal Tour Guide
Ask me questions while you tour the home.