
Seller's Agent in 2025
DANIEL BEIRNE
OpenDoor Brokerage LLC
(480) 462-5392
2,052 Total Sales
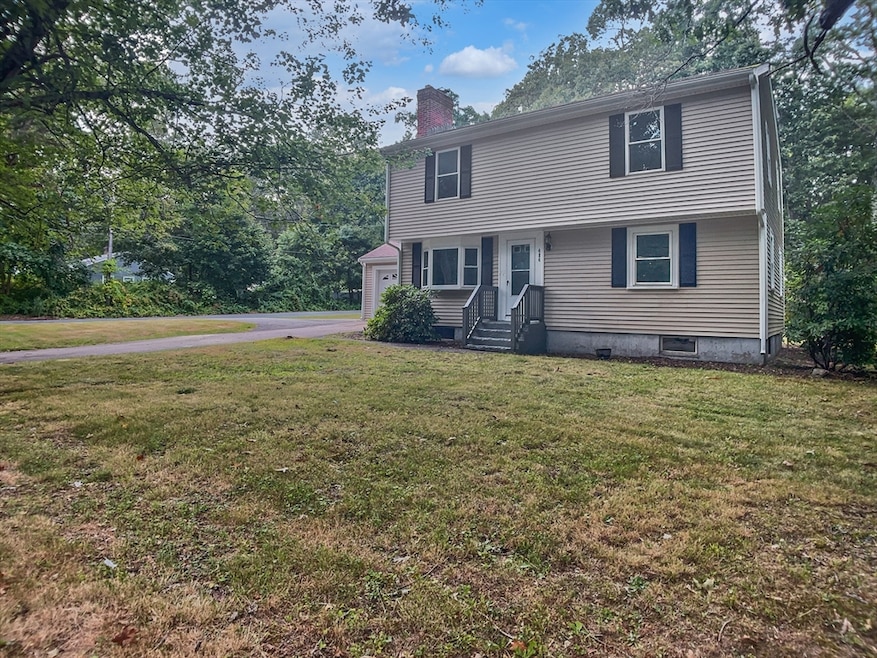
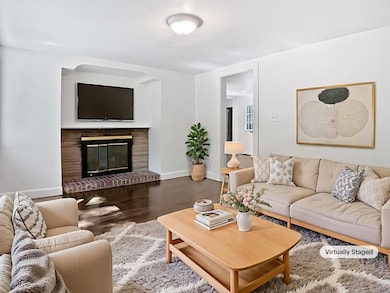
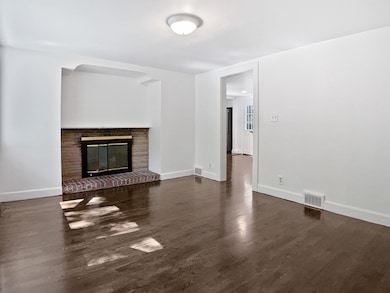

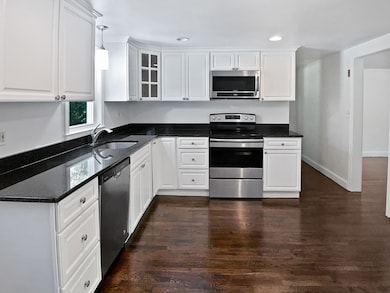
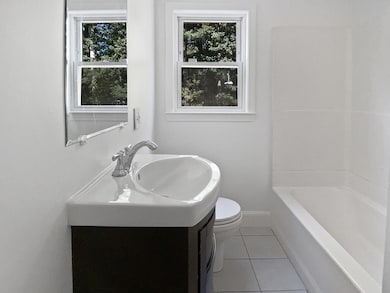
Welcome to this beautifully maintained property, boasting a neutral color paint scheme that adds a touch of elegance to the home. The living room is graced with a cozy fireplace, perfect for those chilly evenings. The kitchen is a chef's dream, equipped with all stainless steel appliances that add a modern touch. The fresh interior paint gives the home a clean and crisp feel. Step outside to the deck, where you can enjoy your morning coffee or entertain. This property is a perfect blend of comfort and style, making it a must-see. Don't miss out on this gem!. Included 100-Day Home Warranty with buyer activation
| Date | Type | Sale Price | Title Company |
|---|---|---|---|
| Quit Claim Deed | $639,175 | -- | |
| Quit Claim Deed | $597,400 | -- | |
| Deed | $597,400 | -- | |
| Quit Claim Deed | -- | -- | |
| Quit Claim Deed | -- | -- | |
| Deed | $130,000 | -- | |
| Deed | $130,000 | -- | |
| Deed | $120,000 | -- | |
| Deed | $120,000 | -- | |
| Deed | $82,000 | -- | |
| Deed | $82,000 | -- |
| Date | Status | Loan Amount | Loan Type |
|---|---|---|---|
| Previous Owner | $123,500 | No Value Available | |
| Previous Owner | $118,345 | No Value Available |
| Date | Event | Price | List to Sale | Price per Sq Ft |
|---|---|---|---|---|
| 11/25/2025 11/25/25 | Sold | $639,175 | -5.2% | $400 / Sq Ft |
| 10/29/2025 10/29/25 | Pending | -- | -- | -- |
| 10/09/2025 10/09/25 | Price Changed | $674,000 | -0.6% | $422 / Sq Ft |
| 09/25/2025 09/25/25 | Price Changed | $678,000 | -2.4% | $425 / Sq Ft |
| 09/10/2025 09/10/25 | For Sale | $695,000 | -- | $435 / Sq Ft |
| Year | Tax Paid | Tax Assessment Tax Assessment Total Assessment is a certain percentage of the fair market value that is determined by local assessors to be the total taxable value of land and additions on the property. | Land | Improvement |
|---|---|---|---|---|
| 2025 | $6,025 | $518,500 | $238,800 | $279,700 |
| 2024 | $5,778 | $490,100 | $238,800 | $251,300 |
| 2023 | $6,027 | $479,100 | $260,600 | $218,500 |
| 2022 | $5,506 | $391,900 | $199,000 | $192,900 |
| 2021 | $5,299 | $361,700 | $207,200 | $154,500 |
| 2020 | $5,164 | $355,900 | $209,000 | $146,900 |
| 2019 | $4,845 | $330,500 | $183,400 | $147,100 |
| 2018 | $4,673 | $319,000 | $187,000 | $132,000 |
| 2017 | $4,599 | $315,400 | $183,400 | $132,000 |
| 2016 | $4,449 | $306,800 | $190,200 | $116,600 |
| 2015 | $4,281 | $288,500 | $171,900 | $116,600 |
| 2014 | $4,097 | $283,500 | $166,900 | $116,600 |
Seller's Agent in 2025
DANIEL BEIRNE
OpenDoor Brokerage LLC
(480) 462-5392
2,052 Total Sales
D
Seller Co-Listing Agent in 2025
David Whitmore
OpenDoor Brokerage LLC
Buyer's Agent in 2025
Ellen McGillivray
Coldwell Banker Realty - Westwood
(617) 759-6199
34 Total Sales
Source: MLS Property Information Network (MLS PIN)
MLS Number: 73429172
APN: FRAN-000249-000000-000012
Disclaimer: Certain information contained herein is derived from information provided by parties other than Homes.com. All information provided is deemed reliable, but is not guaranteed to be accurate and should be independently verified.
![]() The property listing data and information, or the Images, set forth herein were provided to MLS Property Information Network, Inc. from third party sources, including sellers, lessors and public records, and were compiled by MLS Property Information Network, Inc. The property listing data and information, and the Images, are for the personal, non-commercial use of consumers having a good faith interest in purchasing or leasing listed properties of the type displayed to them and may not be used for any purpose other than to identify prospective properties which such consumers may have a good faith interest in purchasing or leasing. MLS Property Information Network, Inc. and its subscribers disclaim any and all representations and warranties as to the accuracy of the property listing data and information, or as to the accuracy of any of the Images, set forth herein.
The property listing data and information, or the Images, set forth herein were provided to MLS Property Information Network, Inc. from third party sources, including sellers, lessors and public records, and were compiled by MLS Property Information Network, Inc. The property listing data and information, and the Images, are for the personal, non-commercial use of consumers having a good faith interest in purchasing or leasing listed properties of the type displayed to them and may not be used for any purpose other than to identify prospective properties which such consumers may have a good faith interest in purchasing or leasing. MLS Property Information Network, Inc. and its subscribers disclaim any and all representations and warranties as to the accuracy of the property listing data and information, or as to the accuracy of any of the Images, set forth herein.
Ask me questions while you tour the home.