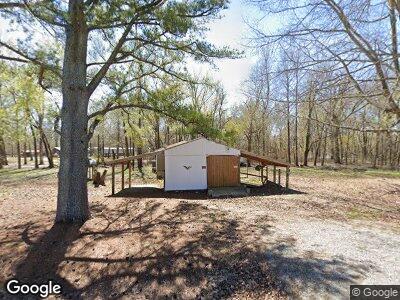
484 River Bend Loop Brownsville, TN 38012
Estimated Value: $61,053 - $198,000
2
Beds
1
Bath
1,392
Sq Ft
$90/Sq Ft
Est. Value
About This Home
This home is located at 484 River Bend Loop, Brownsville, TN 38012 and is currently estimated at $125,263, approximately $89 per square foot. 484 River Bend Loop is a home located in Haywood County with nearby schools including Anderson Early Childhood Center, Haywood Elementary School, and East Side Elementary School.
Ownership History
Date
Name
Owned For
Owner Type
Purchase Details
Closed on
Nov 3, 2021
Sold by
Crotts Dana
Bought by
Knight Casey and Knight Leigh
Current Estimated Value
Purchase Details
Closed on
Jun 16, 2021
Sold by
Morton Bobby
Bought by
Crotts Dana
Purchase Details
Closed on
Jun 3, 2013
Sold by
Alexander Jerry
Bought by
Morton Bobby
Purchase Details
Closed on
Apr 12, 1991
Bought by
Stephens Diane H
Purchase Details
Closed on
Dec 14, 1989
Bought by
Morton Bobby
Purchase Details
Closed on
Sep 7, 1989
Bought by
Morton Bobby and Mortha Dee Moses
Purchase Details
Closed on
Oct 24, 1984
Bought by
Not Available
Purchase Details
Closed on
Jul 27, 1984
Bought by
Not Available
Purchase Details
Closed on
Jan 1, 1984
Bought by
Hayes Warren
Purchase Details
Closed on
Apr 13, 1982
Bought by
Not Available
Purchase Details
Closed on
Jan 1, 1977
Bought by
Not Available
Create a Home Valuation Report for This Property
The Home Valuation Report is an in-depth analysis detailing your home's value as well as a comparison with similar homes in the area
Home Values in the Area
Average Home Value in this Area
Purchase History
| Date | Buyer | Sale Price | Title Company |
|---|---|---|---|
| Knight Casey | $39,000 | None Available | |
| Crotts Dana | -- | None Available | |
| Morton Bobby | $21,000 | -- | |
| Stephens Diane H | $32,500 | -- | |
| Morton Bobby | -- | -- | |
| Morton Bobby | $20,000 | -- | |
| -- | -- | -- | |
| -- | -- | -- | |
| Hayes Warren | $4,000 | -- | |
| -- | -- | -- | |
| -- | $3,000 | -- |
Source: Public Records
Tax History Compared to Growth
Tax History
| Year | Tax Paid | Tax Assessment Tax Assessment Total Assessment is a certain percentage of the fair market value that is determined by local assessors to be the total taxable value of land and additions on the property. | Land | Improvement |
|---|---|---|---|---|
| 2024 | $397 | $20,575 | $2,425 | $18,150 |
| 2023 | $380 | $13,800 | $1,775 | $12,025 |
| 2022 | $380 | $13,800 | $1,775 | $12,025 |
| 2021 | $380 | $13,800 | $1,775 | $12,025 |
| 2020 | $380 | $13,800 | $1,775 | $12,025 |
| 2019 | $380 | $13,800 | $1,775 | $12,025 |
| 2018 | $396 | $13,775 | $1,425 | $12,350 |
| 2017 | $396 | $13,775 | $1,425 | $12,350 |
| 2016 | $352 | $13,775 | $1,425 | $12,350 |
| 2015 | $318 | $13,275 | $1,425 | $11,850 |
| 2014 | $318 | $13,275 | $1,425 | $11,850 |
Source: Public Records
Map
Nearby Homes
- 0 Douglas at Douglas Loop Ridge Unit 10175189
- 0 Joe Sanderlin Rd
- 13 First St E
- 103 Maple St
- 46 Blackgum Rd
- 15870 Highway 70 E
- 0 LOT 2 Charleston Rd
- 0 LOT 1 Charleston Rd
- 5 N Main St
- 0 Freedonia Rd W of Tn Unit RTC2610399
- 00 Shaw Chapel Rd
- 263 Jack Brummett Rd
- 3 Cherry St
- 5 Cherry St
- 0 Tennessee 222
- 3572 Tennessee 54
- 0 Country Club Rd
- 1661 Charleston Rd
- 8633 Stanton Koko Rd
- 0 Morton Hill Rd Unit 10143634
- 484 River Bend Loop
- 000 River Bend Loop
- 463 River Bend Rd
- 60 River Bend Loop
- 475 River Bend Rd
- 497 River Bend Rd
- 497 River Bend Rd
- 140 River Bend Loop
- 449 River Bend Rd
- 557 River Bend Rd
- 35 River Bend Loop
- 399 River Bend Rd
- 573 River Bend Rd
- 371 River Bend Rd
- 587 River Bend Rd
- 83 River Bend Loop
- 372 Fin Feather Bend Rd
- 376 Fin Feather Bend Rd
- 102 River Bend Loop
- 319 River Bend Rd