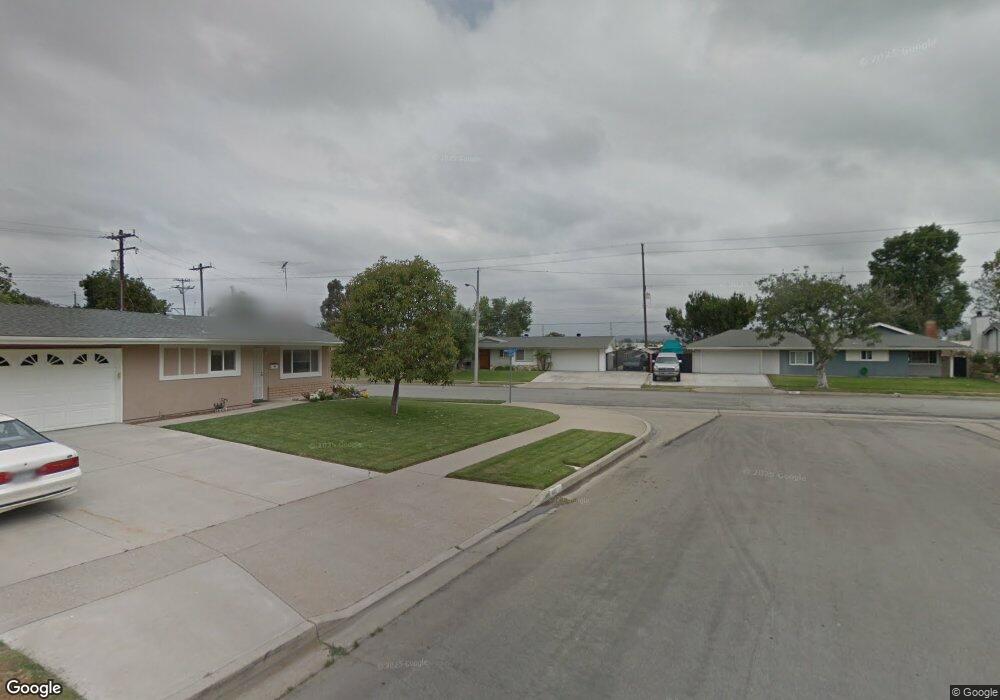
4841 E Maychelle Dr Anaheim, CA 92807
Anaheim Hills NeighborhoodEstimated Value: $916,000 - $1,009,000
3
Beds
2
Baths
1,395
Sq Ft
$679/Sq Ft
Est. Value
About This Home
This home is located at 4841 E Maychelle Dr, Anaheim, CA 92807 and is currently estimated at $946,641, approximately $678 per square foot. 4841 E Maychelle Dr is a home located in Orange County with nearby schools including Olive Elementary School, Canyon High School, and El Rancho Charter.
Ownership History
Date
Name
Owned For
Owner Type
Purchase Details
Closed on
Apr 16, 1999
Sold by
Ehrsam Raymond J
Bought by
Ehrsam Raymond J and Ehrsam Kelly A
Current Estimated Value
Home Financials for this Owner
Home Financials are based on the most recent Mortgage that was taken out on this home.
Original Mortgage
$21,900
Interest Rate
6.98%
Mortgage Type
Stand Alone Second
Purchase Details
Closed on
Mar 23, 1999
Sold by
Ehrsam Raymond J
Bought by
Ehrsam Raymond J and Ehrsam Kelly A
Home Financials for this Owner
Home Financials are based on the most recent Mortgage that was taken out on this home.
Original Mortgage
$21,900
Interest Rate
6.98%
Mortgage Type
Stand Alone Second
Purchase Details
Closed on
Nov 10, 1995
Sold by
Carton Anthony Thomas and Carton Terry D
Bought by
Ehrsam Raymond J
Home Financials for this Owner
Home Financials are based on the most recent Mortgage that was taken out on this home.
Original Mortgage
$156,600
Interest Rate
7.47%
Create a Home Valuation Report for This Property
The Home Valuation Report is an in-depth analysis detailing your home's value as well as a comparison with similar homes in the area
Home Values in the Area
Average Home Value in this Area
Purchase History
| Date | Buyer | Sale Price | Title Company |
|---|---|---|---|
| Ehrsam Raymond J | -- | North American Title Co | |
| Ehrsam Raymond J | -- | Chicago Title Co | |
| Ehrsam Raymond J | $174,000 | Fidelity National Title Ins |
Source: Public Records
Mortgage History
| Date | Status | Borrower | Loan Amount |
|---|---|---|---|
| Closed | Ehrsam Raymond J | $21,900 | |
| Open | Ehrsam Raymond J | $159,000 | |
| Closed | Ehrsam Raymond J | $156,600 |
Source: Public Records
Tax History
| Year | Tax Paid | Tax Assessment Tax Assessment Total Assessment is a certain percentage of the fair market value that is determined by local assessors to be the total taxable value of land and additions on the property. | Land | Improvement |
|---|---|---|---|---|
| 2025 | $3,313 | $289,048 | $192,635 | $96,413 |
| 2024 | $3,313 | $283,381 | $188,858 | $94,523 |
| 2023 | $3,236 | $277,825 | $185,155 | $92,670 |
| 2022 | $3,169 | $272,378 | $181,525 | $90,853 |
| 2021 | $3,083 | $267,038 | $177,966 | $89,072 |
| 2020 | $3,053 | $264,300 | $176,141 | $88,159 |
| 2019 | $3,016 | $259,118 | $172,687 | $86,431 |
| 2018 | $2,969 | $254,038 | $169,301 | $84,737 |
| 2017 | $2,850 | $249,057 | $165,981 | $83,076 |
| 2016 | $2,795 | $244,174 | $162,726 | $81,448 |
| 2015 | $2,757 | $240,507 | $160,282 | $80,225 |
| 2014 | $2,698 | $235,796 | $157,142 | $78,654 |
Source: Public Records
Map
Nearby Homes
- 321 N Starfire St
- 135 N Laurie Ann Ln
- 1769 N Woodwind Ln
- 18501 Woodwind Ln
- 1971 Avenida Del Sol
- 1968 Via de la Luna
- 1963 Avenida Del Sol
- 4924 E Budlong St
- 1954 Avenida Del Sol
- 415 S Brook Ln
- 420 S Rolling Hills Place
- 1801 N Glenview Ave
- 1780 N Azure St
- 106 S Vista Grande
- 5489 E Suncrest Rd
- 4926 E Glenview Ave
- 4938 E Glenview Ave
- 1865 N Garland Ln
- 2024 Tanforan Ave
- 640 S Londerry Ln
- 4837 E Maychelle Dr
- 4847 E Maychelle Dr
- 4833 E Maychelle Dr
- 441 N Citrus View Dr
- 4851 E Maychelle Dr
- 440 N Manti Dr
- 4850 E Maychelle Dr
- 4829 E Maychelle Dr
- 437 N Citrus View Dr
- 4855 E Maychelle Dr
- 436 N Manti Dr
- 4854 E Maychelle Dr
- 433 N Citrus View Dr
- 4851 E Mckay Cir
- 4825 E Maychelle Dr
- 4859 E Maychelle Dr
- 4855 E Mckay Cir
- 432 N Manti Dr
- 4858 E Maychelle Dr
- 441 N Manti Dr
Your Personal Tour Guide
Ask me questions while you tour the home.