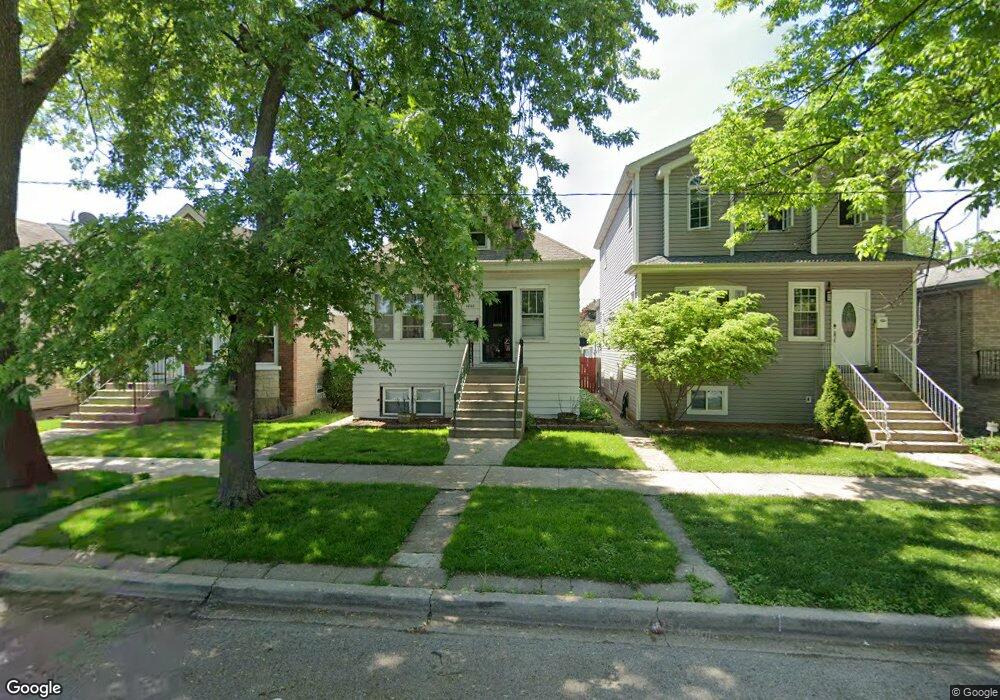
4848 N Moody Ave Chicago, IL 60630
Jefferson Park NeighborhoodEstimated Value: $375,000 - $415,000
2
Beds
1
Bath
830
Sq Ft
$475/Sq Ft
Est. Value
About This Home
This home is located at 4848 N Moody Ave, Chicago, IL 60630 and is currently estimated at $394,389, approximately $475 per square foot. 4848 N Moody Ave is a home located in Cook County with nearby schools including Garvy J Elementary School, Taft High School, and St. Constance School.
Ownership History
Date
Name
Owned For
Owner Type
Purchase Details
Closed on
May 23, 2007
Sold by
Tynan Elizabeth P and Quinn Paul
Bought by
Quinn Paul and Quinn Anne
Current Estimated Value
Home Financials for this Owner
Home Financials are based on the most recent Mortgage that was taken out on this home.
Original Mortgage
$83,950
Interest Rate
6.21%
Mortgage Type
New Conventional
Purchase Details
Closed on
Jul 29, 2004
Sold by
Jost Josephine M
Bought by
Tynan Elizabeth and Quinn Paul
Home Financials for this Owner
Home Financials are based on the most recent Mortgage that was taken out on this home.
Original Mortgage
$272,000
Outstanding Balance
$135,776
Interest Rate
6.1%
Mortgage Type
Unknown
Estimated Equity
$258,613
Purchase Details
Closed on
Oct 2, 2003
Sold by
Jost Josephine M
Bought by
Jost Josephine M and Josephine M Jost Trust
Create a Home Valuation Report for This Property
The Home Valuation Report is an in-depth analysis detailing your home's value as well as a comparison with similar homes in the area
Home Values in the Area
Average Home Value in this Area
Purchase History
| Date | Buyer | Sale Price | Title Company |
|---|---|---|---|
| Quinn Paul | -- | Git | |
| Tynan Elizabeth | $272,000 | Atgf Inc | |
| Jost Josephine M | -- | -- |
Source: Public Records
Mortgage History
| Date | Status | Borrower | Loan Amount |
|---|---|---|---|
| Closed | Quinn Paul | $83,950 | |
| Open | Tynan Elizabeth | $272,000 |
Source: Public Records
Tax History Compared to Growth
Tax History
| Year | Tax Paid | Tax Assessment Tax Assessment Total Assessment is a certain percentage of the fair market value that is determined by local assessors to be the total taxable value of land and additions on the property. | Land | Improvement |
|---|---|---|---|---|
| 2024 | $5,000 | $28,000 | $9,300 | $18,700 |
| 2023 | $4,853 | $27,000 | $7,440 | $19,560 |
| 2022 | $4,853 | $27,000 | $7,440 | $19,560 |
| 2021 | $4,763 | $27,000 | $7,440 | $19,560 |
| 2020 | $4,277 | $22,289 | $4,650 | $17,639 |
| 2019 | $4,289 | $24,766 | $4,650 | $20,116 |
| 2018 | $4,216 | $24,766 | $4,650 | $20,116 |
| 2017 | $3,521 | $19,722 | $4,092 | $15,630 |
| 2016 | $3,452 | $19,722 | $4,092 | $15,630 |
| 2015 | $3,325 | $20,760 | $4,092 | $16,668 |
| 2014 | $2,916 | $18,272 | $3,720 | $14,552 |
| 2013 | $2,847 | $18,272 | $3,720 | $14,552 |
Source: Public Records
Map
Nearby Homes
- 6140 W Gunnison St Unit 3
- 4886 N Austin Ave
- 6228 W Lawrence Ave
- 5000 N Mobile Ave
- 6316 W Lawrence Ave
- 6046 W Giddings St
- 5915 W Gunnison St Unit 2F
- 6137 W Giddings St
- 5921 W Lawrence Ave
- 4702 N Austin Ave Unit 302
- 5133 N Austin Ave
- 5119 N Mason Ave
- 6420 W Gunnison St
- 5942 W Eastwood Ave
- 4567 N Merrimac Ave
- 5901 W Foster Ave
- 5148 N Monitor Ave Unit 301
- 5940 W Wilson Ave
- 5301 N Melvina Ave
- 6520 W Gunnison St
- 4850 N Moody Ave
- 4854 N Moody Ave
- 4842 N Moody Ave
- 4856 N Moody Ave
- 4838 N Moody Ave
- 4836 N Moody Ave
- 4849 N Melvina Ave
- 4845 N Melvina Ave
- 4853 N Melvina Ave
- 4832 N Moody Ave
- 4857 N Melvina Ave
- 4839 N Melvina Ave
- 4843 N Melvina Ave
- 4843 N Melvina Ave Unit 2
- 4843 N Melvina Ave Unit 1
- 4835 N Melvina Ave
- 4849 N Moody Ave
- 4845 N Moody Ave
- 4851 N Moody Ave
- 4843 N Moody Ave