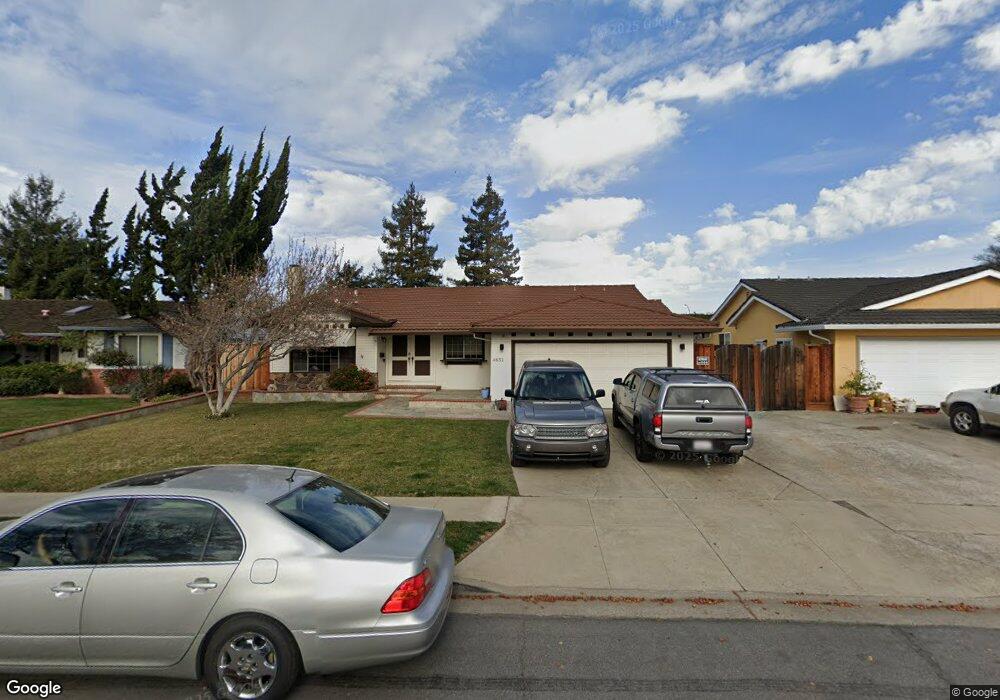
4851 Windermere Dr Newark, CA 94560
Estimated Value: $1,507,000 - $1,703,234
4
Beds
2
Baths
1,822
Sq Ft
$878/Sq Ft
Est. Value
About This Home
This home is located at 4851 Windermere Dr, Newark, CA 94560 and is currently estimated at $1,600,309, approximately $878 per square foot. 4851 Windermere Dr is a home located in Alameda County with nearby schools including John F. Kennedy Elementary School, Newark Junior High School, and Newark Memorial High School.
Ownership History
Date
Name
Owned For
Owner Type
Purchase Details
Closed on
Jun 17, 2020
Sold by
Uribe Christina and Uribe Luis S
Bought by
Uribe Luis Salvador and Uribe Christina
Current Estimated Value
Home Financials for this Owner
Home Financials are based on the most recent Mortgage that was taken out on this home.
Original Mortgage
$660,000
Outstanding Balance
$585,039
Interest Rate
3.2%
Mortgage Type
New Conventional
Estimated Equity
$1,015,270
Purchase Details
Closed on
Aug 5, 2019
Sold by
Sanchez Benjamin J and Sanchez Margo A
Bought by
Uribe Christina and Uribe Luis S
Home Financials for this Owner
Home Financials are based on the most recent Mortgage that was taken out on this home.
Original Mortgage
$726,525
Interest Rate
3.7%
Mortgage Type
New Conventional
Create a Home Valuation Report for This Property
The Home Valuation Report is an in-depth analysis detailing your home's value as well as a comparison with similar homes in the area
Home Values in the Area
Average Home Value in this Area
Purchase History
| Date | Buyer | Sale Price | Title Company |
|---|---|---|---|
| Uribe Luis Salvador | -- | Fidelity National Title | |
| Uribe Luis Salvador | -- | Fidelity National Title | |
| Uribe Luis Salvador | -- | Fidelity National Title | |
| Uribe Christina | $955,000 | Fidelity National Title Co |
Source: Public Records
Mortgage History
| Date | Status | Borrower | Loan Amount |
|---|---|---|---|
| Open | Uribe Luis Salvador | $660,000 | |
| Closed | Uribe Christina | $726,525 |
Source: Public Records
Tax History
| Year | Tax Paid | Tax Assessment Tax Assessment Total Assessment is a certain percentage of the fair market value that is determined by local assessors to be the total taxable value of land and additions on the property. | Land | Improvement |
|---|---|---|---|---|
| 2025 | $13,481 | $1,141,416 | $437,452 | $710,964 |
| 2024 | $13,481 | $1,100,841 | $428,876 | $678,965 |
| 2023 | $13,001 | $1,074,867 | $420,468 | $654,399 |
| 2022 | $12,521 | $1,018,184 | $412,224 | $612,960 |
| 2021 | $11,740 | $957,893 | $404,144 | $560,749 |
| 2020 | $11,631 | $955,000 | $400,000 | $555,000 |
| 2019 | $3,517 | $257,956 | $59,471 | $198,485 |
| 2018 | $3,460 | $252,899 | $58,305 | $194,594 |
| 2017 | $3,371 | $247,941 | $57,162 | $190,779 |
| 2016 | $3,324 | $243,080 | $56,041 | $187,039 |
| 2015 | $3,311 | $239,429 | $55,199 | $184,230 |
| 2014 | $3,216 | $234,740 | $54,118 | $180,622 |
Source: Public Records
Map
Nearby Homes
- 35290 Farnham Dr
- 35345 Cabral Dr
- 4862 Garnet Common
- 5136 Ramsgate Dr
- 35605 Scarborough Dr
- 35795 Cabral Dr
- 34827 Dorado Common
- 34631 Pueblo Terrace Unit 99
- 4987 Winchester Place
- 34607 Pueblo Terrace
- 34744 Tuxedo Common
- 34767 Shalimar Terrace
- 34743 Chanel Terrace
- 4409 Darwin Dr
- 36120 Pizarro Dr
- 34590 Falls Terrace
- 5245 Tacoma Common
- 4691 Rousillon Ave
- 35415 Blackburn Dr
- 34597 Bluestone Common
- 4845 Windermere Dr
- 4857 Windermere Dr
- 4839 Windermere Dr
- 35216 Oldham Place
- 35210 Oldham Place
- 4838 Windermere Dr
- 4820 Windermere Dr
- 4833 Windermere Dr
- 4844 Windermere Dr
- 35196 Oldham Place
- 4850 Windermere Dr
- 4810 Windermere Dr
- 4827 Windermere Dr
- 35298 Farnham Dr
- 4856 Windermere Dr
- 4821 Windermere Dr
- 35294 Farnham Dr
- 35188 Oldham Place
- 4815 Windermere Dr
- 4802 Windermere Dr
Your Personal Tour Guide
Ask me questions while you tour the home.