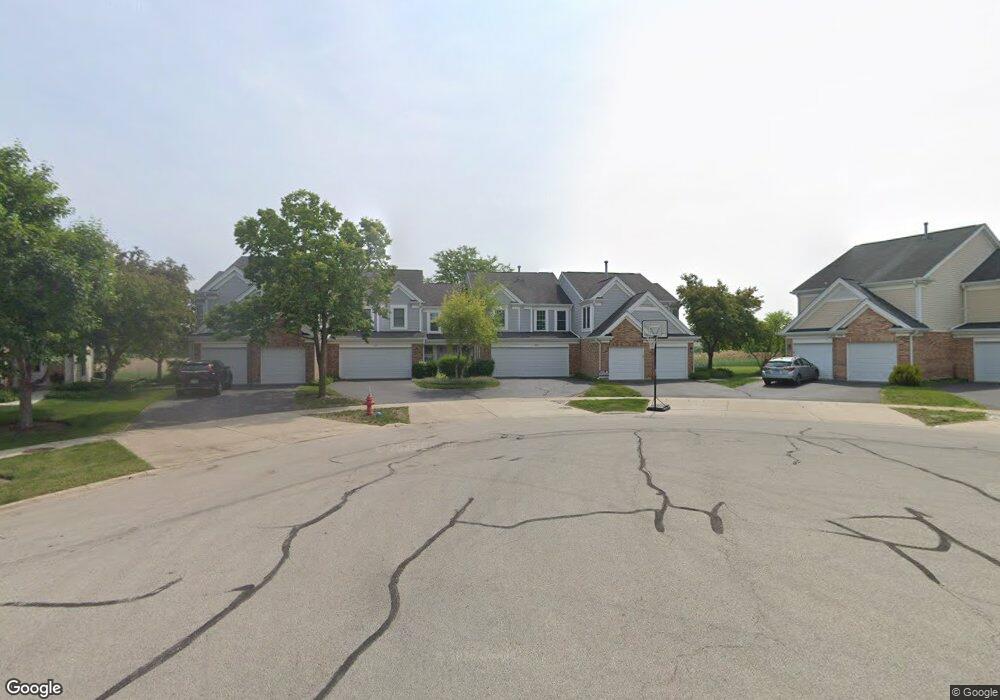
4855 Turnberry Dr Hoffman Estates, IL 60010
South Ridge NeighborhoodEstimated Value: $387,000 - $401,307
3
Beds
3
Baths
2,046
Sq Ft
$193/Sq Ft
Est. Value
About This Home
This home is located at 4855 Turnberry Dr, Hoffman Estates, IL 60010 and is currently estimated at $394,077, approximately $192 per square foot. 4855 Turnberry Dr is a home located in Cook County with nearby schools including Thomas Jefferson Elementary School, Marion Jordan Elementary School, and Nielson Elementary School.
Ownership History
Date
Name
Owned For
Owner Type
Purchase Details
Closed on
Apr 13, 2017
Sold by
Matsuda Yume
Bought by
Castilo Reyes Jr Efren and Castilo Reyes Marie Jane
Current Estimated Value
Home Financials for this Owner
Home Financials are based on the most recent Mortgage that was taken out on this home.
Original Mortgage
$255,189
Interest Rate
4.25%
Mortgage Type
FHA
Purchase Details
Closed on
Apr 25, 2005
Sold by
Grandberry Walter L
Bought by
Matsuda Yumie
Home Financials for this Owner
Home Financials are based on the most recent Mortgage that was taken out on this home.
Original Mortgage
$120,000
Interest Rate
6.05%
Mortgage Type
Fannie Mae Freddie Mac
Purchase Details
Closed on
Sep 24, 1999
Sold by
Scott Sherryl R
Bought by
Grandberry Walter L
Home Financials for this Owner
Home Financials are based on the most recent Mortgage that was taken out on this home.
Original Mortgage
$161,500
Interest Rate
7.9%
Create a Home Valuation Report for This Property
The Home Valuation Report is an in-depth analysis detailing your home's value as well as a comparison with similar homes in the area
Home Values in the Area
Average Home Value in this Area
Purchase History
| Date | Buyer | Sale Price | Title Company |
|---|---|---|---|
| Castilo Reyes Jr Efren | $260,000 | First American Title | |
| Matsuda Yumie | $280,000 | Pntn | |
| Grandberry Walter L | $190,000 | Chicago Title Insurance Co |
Source: Public Records
Mortgage History
| Date | Status | Borrower | Loan Amount |
|---|---|---|---|
| Previous Owner | Castilo Reyes Jr Efren | $255,189 | |
| Previous Owner | Matsuda Yumie | $120,000 | |
| Previous Owner | Grandberry Walter L | $161,500 |
Source: Public Records
Tax History Compared to Growth
Tax History
| Year | Tax Paid | Tax Assessment Tax Assessment Total Assessment is a certain percentage of the fair market value that is determined by local assessors to be the total taxable value of land and additions on the property. | Land | Improvement |
|---|---|---|---|---|
| 2024 | $7,735 | $28,545 | $5,000 | $23,545 |
| 2023 | $7,445 | $28,545 | $5,000 | $23,545 |
| 2022 | $7,445 | $28,545 | $5,000 | $23,545 |
| 2021 | $6,463 | $22,630 | $1,821 | $20,809 |
| 2020 | $6,395 | $22,630 | $1,821 | $20,809 |
| 2019 | $7,333 | $25,089 | $1,821 | $23,268 |
| 2018 | $9,003 | $28,416 | $1,675 | $26,741 |
| 2017 | $8,835 | $28,416 | $1,675 | $26,741 |
| 2016 | $8,200 | $28,416 | $1,675 | $26,741 |
| 2015 | $7,351 | $23,652 | $1,529 | $22,123 |
| 2014 | $7,212 | $23,652 | $1,529 | $22,123 |
| 2013 | $7,341 | $24,698 | $1,529 | $23,169 |
Source: Public Records
Map
Nearby Homes
- 4950 Tarrington Dr
- 1195 Old Timber Ct
- 4564 Topaz Dr
- 1404 W Sapphire Dr
- 5190 Chambers Dr
- 13 Chipping Campden Dr
- 121 Florence Ave
- 330 Poteet Ave
- 1987 Selkirk Ct
- 217 Haman Rd
- 2204 Shetland Rd
- 70 Ela Rd
- 61 E Palatine Rd
- 4080 Fir Ct
- 61 E Rd
- 61 E Rd
- 61 E Palatine #4 Rd
- 1100 Macalpin Dr
- 1340 Macalpin Dr
- 1842 Thomas Atkinson Rd
- 4857 Turnberry Dr
- 4853 Turnberry Dr
- 4859 Turnberry Dr
- 4843 Turnberry Dr
- 4869 Turnberry Dr
- 4841 Turnberry Dr
- 4871 Turnberry Dr
- 4839 Turnberry Dr
- 4873 Turnberry Dr
- 4837 Turnberry Dr
- 4825 Turnberry Dr
- 4872 Turnberry Dr
- 4885 Turnberry Dr
- 4823 Turnberry Dr
- 4874 Turnberry Dr
- 4887 Turnberry Dr
- 4821 Turnberry Dr
- 4876 Turnberry Dr
- 4889 Turnberry Dr
- 4819 Turnberry Dr